





A customer health score is a single number that tells you which accounts are quietly leaving, built from four signals you already collect: usage recency, support ticket volume, invoice status, and days since the last human contact. You do not need a data team, a warehouse, or a twelve-factor model to run one. You need one row per account, a weighted sum you can defend in a sentence, and a weekly review that lands on a named owner's list with a due date.
Most teams discover churn on the renewal date. The account goes quiet in March, the invoice slips in April, nobody notices because nobody owns noticing, and in May a one-line email ends a relationship that took nine months to build. Nothing in that sequence was hidden. Every signal was sitting in a tool someone on the team already had open.
The gap is not data. The gap is that nobody assembled the data into a number, and nobody put the number in front of a person whose job it was to act on it.
What Is a Customer Health Score?
A customer health score is a 0–100 summary of how likely an account is to renew, calculated from behavior rather than opinion. It replaces the sentence "I think they're happy" with a number that anyone on the team can check, challenge, and act on. The score is deliberately crude. Its job is not to be right about every account — its job is to sort the list so the six accounts that need attention this week rise to the top of a list of two hundred.
The score is worthless on its own. What makes it work is the loop it sits inside: signals feed a score, the score raises a flag, the flag creates a task, the task has an owner, and the outcome of that outreach writes back into the record. That loop is what Workspace DNA describes — Memory, Intelligence, and Execution operating on the same record instead of in three disconnected tools.
Which Four Signals Actually Predict Churn?
Usage recency is the strongest single predictor, because an account that has stopped logging in has already left in every way except billing. The other three catch the failure modes usage alone misses: the account that is active but frustrated, the account that is active but quietly deciding, and the account that is fine but forgotten.
| Signal | Where it comes from | Weight | Reads as at-risk when |
|---|---|---|---|
| Usage recency | Product analytics, login events, app opens | 40 | No meaningful session in 14+ days |
| Ticket signal | Support inbox, shared email, help desk | 20 | A spike above baseline — or total silence from a formerly chatty account |
| Invoice status | Payment processor, accounting tool | 20 | Any invoice past due, or a failed charge not retried |
| Last human contact | Calendar, email, call log | 20 | 45+ days since a real conversation with a human |
Four signals is enough. Teams that hold out for a perfect twelve-signal model usually ship nothing, and a crude score running every week beats an elegant score that exists in a planning document. Add a fifth signal only after you have watched the first four be wrong about a specific account and you know exactly what would have caught it.
One nuance worth naming: ticket volume is not monotonic. A sudden spike means friction, and a sudden silence from an account that used to write in every week means disengagement. Both deserve points off. If you only penalize the loud accounts, you will systematically miss the ones drifting away.
How Do You Weight the Score Without a Data Team?
Use a weighted sum you can explain in one sentence, then correct it with evidence after a quarter of real outcomes. Every input is scored 0–1 for how healthy it looks, multiplied by its weight, and added up. That is the whole method.
health = (usage_recency  × 40)
       + (ticket_signal  × 20)
       + (invoice_status × 20)
       + (last_contact   × 20)usage_recency   1.0 if active this week · 0.5 if 7–14d · 0.0 if 14d+
ticket_signal   1.0 if normal · 0.5 if spike or silence · 0.0 if both
invoice_status  1.0 if current · 0.5 if due soon · 0.0 if past due
last_contact    1.0 if under 30d · 0.5 if 30–45d · 0.0 if 45d+
flag threshold  < 60
Store one account per row in a Table view with those four inputs as fields and the score as a computed column. Taskade ships multiple project views over the same data — List, Board, Calendar, Table, Mind Map, Gantt, and Org Chart — so the same account records render as a scoring table for the analyst, a board of at-risk accounts for the success lead, and a calendar of renewal dates for the founder. One record, three ways of looking at it.
Here is the loop the score sits inside:
The dashed return line is the part most trackers skip. If the outcome of an outreach never writes back, the score keeps flagging the same account forever and the team learns to scroll past it.
How Do You Run the Weekly At-Risk Review?
Set one scheduled trigger for the same morning every week, filter the account list down to scores below your threshold, and create one task per flagged account with a named owner and a due date. That is three automation steps and it is the entire operational surface of the system.
A Taskade automation runs as a bounded pass over a defined set of items. The weekly review walks the filtered account list once and performs the same steps for each row, then stops. It is a finite per-item loop with a strict nesting limit — not an open-ended process that runs until some goal is reached. That boundary is precisely what makes a scheduled review safe to leave running unattended for six months, which is how long it takes for this kind of system to prove its value.
The signals stay current on their own. Taskade connects to 100+ bidirectional integrations, so triggers pull events in from the tools your customers touch and actions push updates back out. A payment event updates invoice status, a support event updates the ticket count, a calendar event resets the last-contact clock. Nobody maintains a spreadsheet by hand, which matters because the first thing a manually-maintained health tracker loses is its manual maintenance.
Then add the part a formula cannot produce. An AI agent reads the score alongside the raw signals and writes back the reason — "logins dropped after their ops lead left in June, two tickets about the import flow, invoice 14 days past due." Taskade AI Agents ship with built-in tools, including web search, file analysis, persistent memory, and custom slash commands, and run on 15+ frontier models from OpenAI, Anthropic, Google, and open-weight providers. Auto is the default setting, so you are not choosing a model every time you want a summary. Wiring agents into the scheduled pass is covered in agent automation, the full automation library has the trigger and action patterns, and the memory that makes the second month's summary better than the first is described in agent memory.
Start With a Live Kit
Six apps below are running in production right now. Open any of them, clone it, and change the fields to match your accounts — that is a faster start than a blank page, and every one of them already has the score, the flag, and the owner field wired.
| App | What it does for retention | Take it |
|---|---|---|
| Customer Health | Account rows with health, churn, and renewal fields — the tracker in this post, already built | Clone it → |
| Neon CRM Dashboard | Pipeline and account records, so the health score sits next to the deal that created it | Clone it → |
| Onboarding Portal | Fixes churn at the source — accounts that never reach first value never renew | Clone it → |
| Client Portal | Gives the customer a live view of their own status, which resets the last-contact clock passively | Clone it → |
| Smart Feedback Form | Captures the sentiment signal that usage data alone cannot see | Clone it → |
| Insight Analyst | An agent that reads the account table and explains what moved, in plain English | Clone it → |
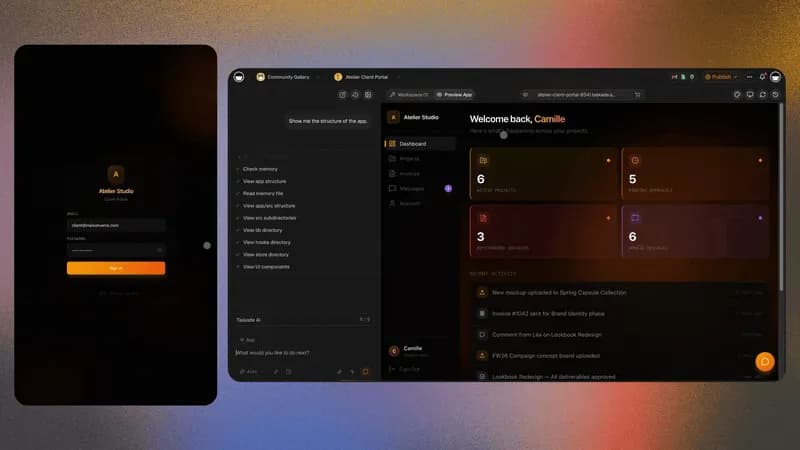
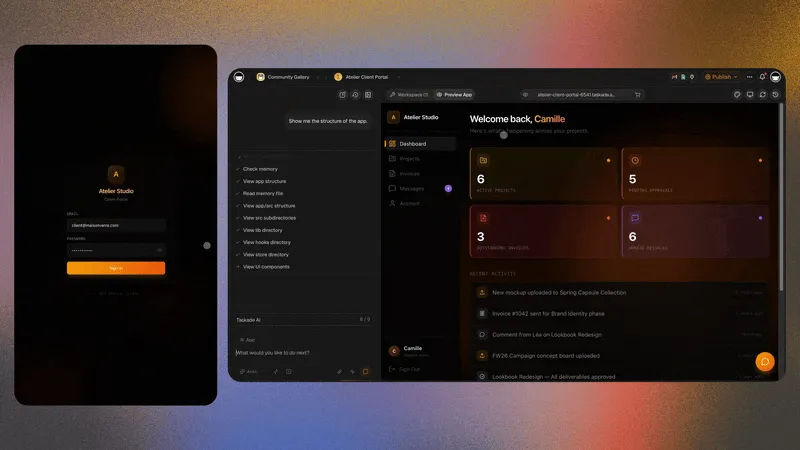
Here is the Customer Health app running live. Open it, look at the account rows, then take it:
More live apps to clone are in the Community gallery, and if you would rather start from a prompt than from a clone, describe your account structure to Taskade Genesis and it will generate the workspace, fields, and schedule for you. The first app walkthrough covers the whole path, and building a dashboard covers the reporting layer on top.
Who Owns the Save?
One named person per account, always. A flag with no owner is a report; a flag with an owner is a save. Taskade uses a role model from Owner through Viewer, so the account owner gets full edit rights on the tracker, the wider team gets read access to the same dashboard, and the review stays honest without anyone overwriting anyone else's notes. The roles and permissions guide covers the full ladder.
This is also where the tracker stops being an internal artifact. Publish the account view as a live app, invite the customer in as an app user, and the record that flags risk internally becomes a shared status page externally. Accounts that can see their own usage, open items, and next milestone renew with far less persuasion than accounts that only hear from you when something has gone wrong. That pattern is explored further in self-updating client portals and AI client portal examples.
What Does It Cost to Run This?
You can build the whole tracker on the Free plan and run the scoring agent against it on demand — Free includes a one-time grant of up to 6,000 AI credits, 1,000 when you verify your account and 5,000 on your first build, sized so that signing up and building once funds one complete app end to end. The scheduled weekly review is the part that needs Pro, because that is where automations switch on.
| Plan | Price | What it adds for this use case |
|---|---|---|
| Free | $0 | Build the tracker and run the scoring agent on demand, up to 6,000 lifetime AI credits. The scheduled weekly review needs Pro |
| Pro | $10/mo billed annually ($120/yr) | Ongoing agent runs and automation headroom for a growing account list |
| Business | $25/mo billed annually | Single sign-on and custom domains for the customer-facing version |
Full details are on the pricing page. The honest framing: the tracker is not the expensive part. The expensive part is the quarter you spend not knowing which six accounts needed a call.
Frequently Asked Questions
What is a customer health score?
A 0–100 number summarizing how likely an account is to stay, calculated from behavioral signals rather than opinion. The four highest-value inputs for a small team are usage recency, ticket volume, invoice status, and days since last human contact.
Which signals best predict customer churn?
Usage recency is the strongest, because an account that stopped logging in has already left in every way except billing. Ticket volume matters in both directions — a spike and a silence are both risk. Invoice status catches quiet deciders, and last human contact catches forgotten accounts.
How do you build a health score without a data team?
Weight the four signals 40/20/20/20, score each 0–1, and sum them. Store one account per row in a Table view with the score as a computed column. Describe that structure in a prompt to Taskade Genesis and you get a working app with fields and schedule already wired.
How often should you review at-risk accounts?
Weekly, for most teams under a few hundred accounts. Monthly misses usage drops before a renewal date. Daily produces alert fatigue and trains people to ignore the flag.
Can an automation loop over every at-risk account?
Yes. A Taskade automation is a bounded pass over a defined set of items — it walks the filtered list once, does the same steps per row, and stops. Nesting is strictly limited, which is what makes an unattended weekly schedule safe.
What can an AI agent add that a formula cannot?
The reason behind the number. Agents summarize recent tickets, note the missed invoice, and draft the first outreach message. Taskade AI Agents ship with built-in tools and run on 15+ frontier models from OpenAI, Anthropic, Google, and open-weight providers.
Who should own an at-risk account?
One named person, always. Taskade's role model from Owner through Viewer lets the account owner edit the tracker while the wider team keeps read access to the same dashboard.
What threshold should trigger outreach?
Start at 60 out of 100 and adjust after a quarter of real outcomes. The right threshold produces a flag list your team can actually work through in a week.
Can the tracker pull from tools we already use?
Yes — 100+ bidirectional integrations mean triggers pull events in and actions push updates back out. Payment events update invoice status, support events update ticket counts, calendar events reset the last-contact clock.
Do we need a CRM first?
No. A health tracker is one row per account and four fields, which is smaller than a CRM and a reasonable first system. The same workspace grows into a full CRM later without a migration.
Keep the Accounts You Won
Winning an account takes months. Losing one takes a quarter of nobody looking. The difference between those two outcomes is not a better product, a bigger success team, or a more sophisticated model — it is one number, refreshed weekly, sitting in front of a person who owns doing something about it.
Build it this week. Four fields, one weighted sum, one scheduled review, one owner per flag. Then let the accounts you already won stay won.
Related reading: SaaS metrics dashboard templates · AI customer onboarding software · AI sales CRM dashboards · Best customer portal software · Agency retainer tracker
Build the pieces: dashboard generators · CRM agents · sales automations · client onboarding templates
Memory of every account, intelligence that reads it, execution that acts on it. ▲ ■ ●