





Every model launch comes with a bar chart. The new model is taller. The competitor bars are shorter. The chart is real, the numbers are real, and within about eighteen months the whole chart will be meaningless because every serious system will score near the top of it.
That is not a scandal. It is the normal life cycle of an AI benchmark, and it has repeated roughly a dozen times since 1998. Understanding the cycle is the difference between reading a launch chart as evidence and reading it as marketing.
This is the history of how the field learned to measure machine intelligence, why every measure eventually breaks, and what to actually look at instead.
TL;DR: AI benchmarks saturate fast. GLUE was surpassed by non-expert humans in about a year, SWE-bench went from 1.96 percent solved to routine double-digit scores in months, and a 2022 study of 3,765 benchmarks found rapid saturation is the norm. Judge tools on your own tasks instead: build an eval set.
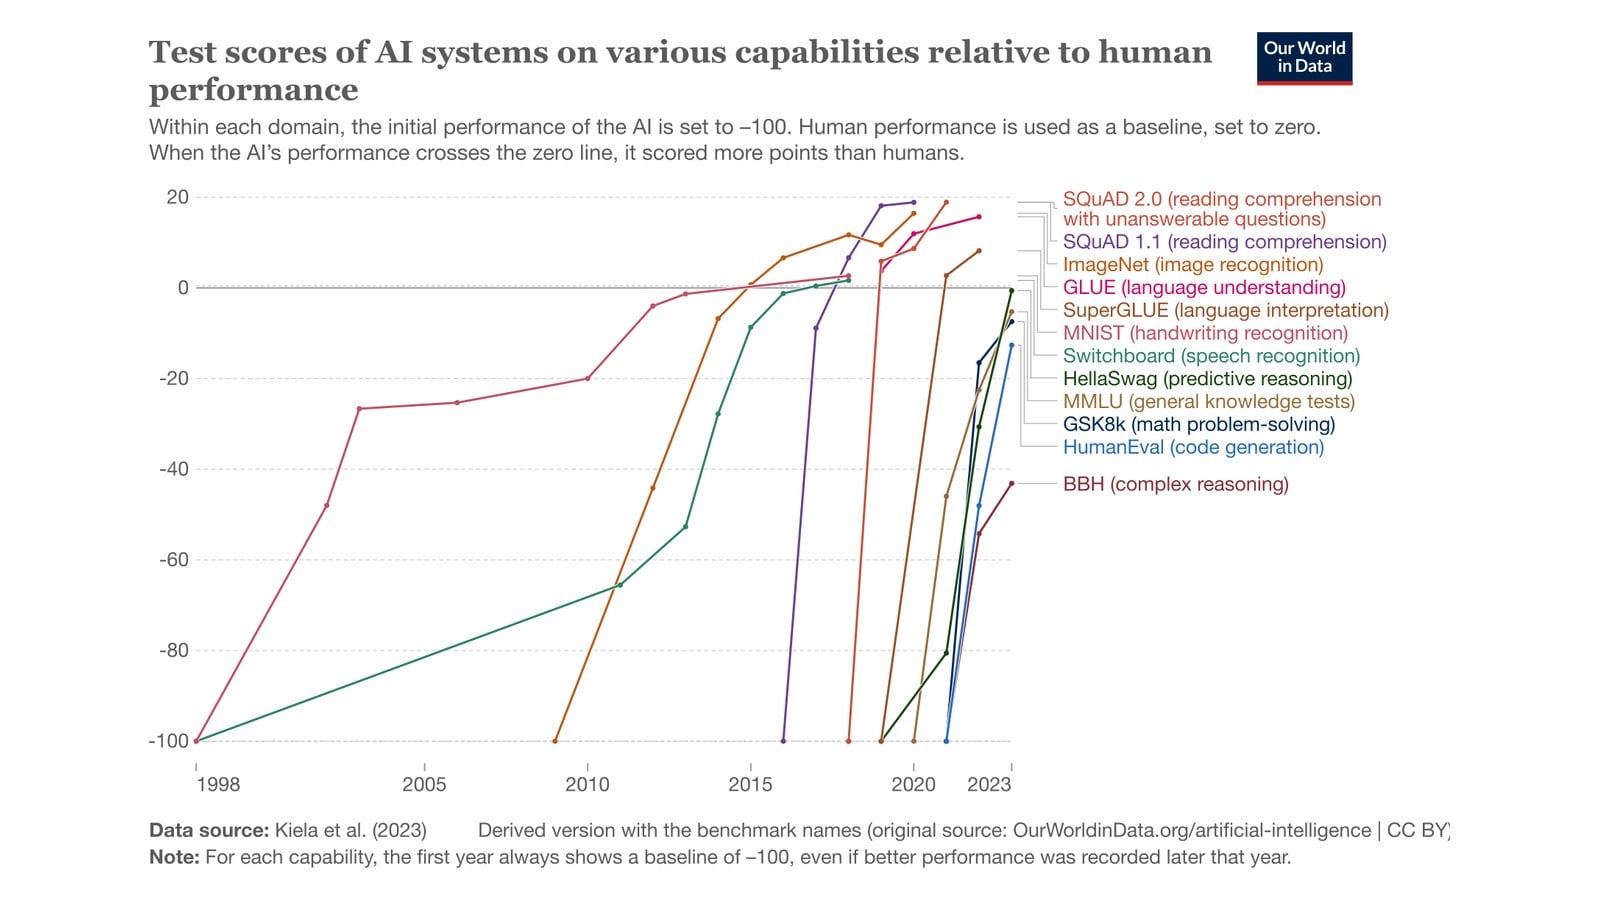
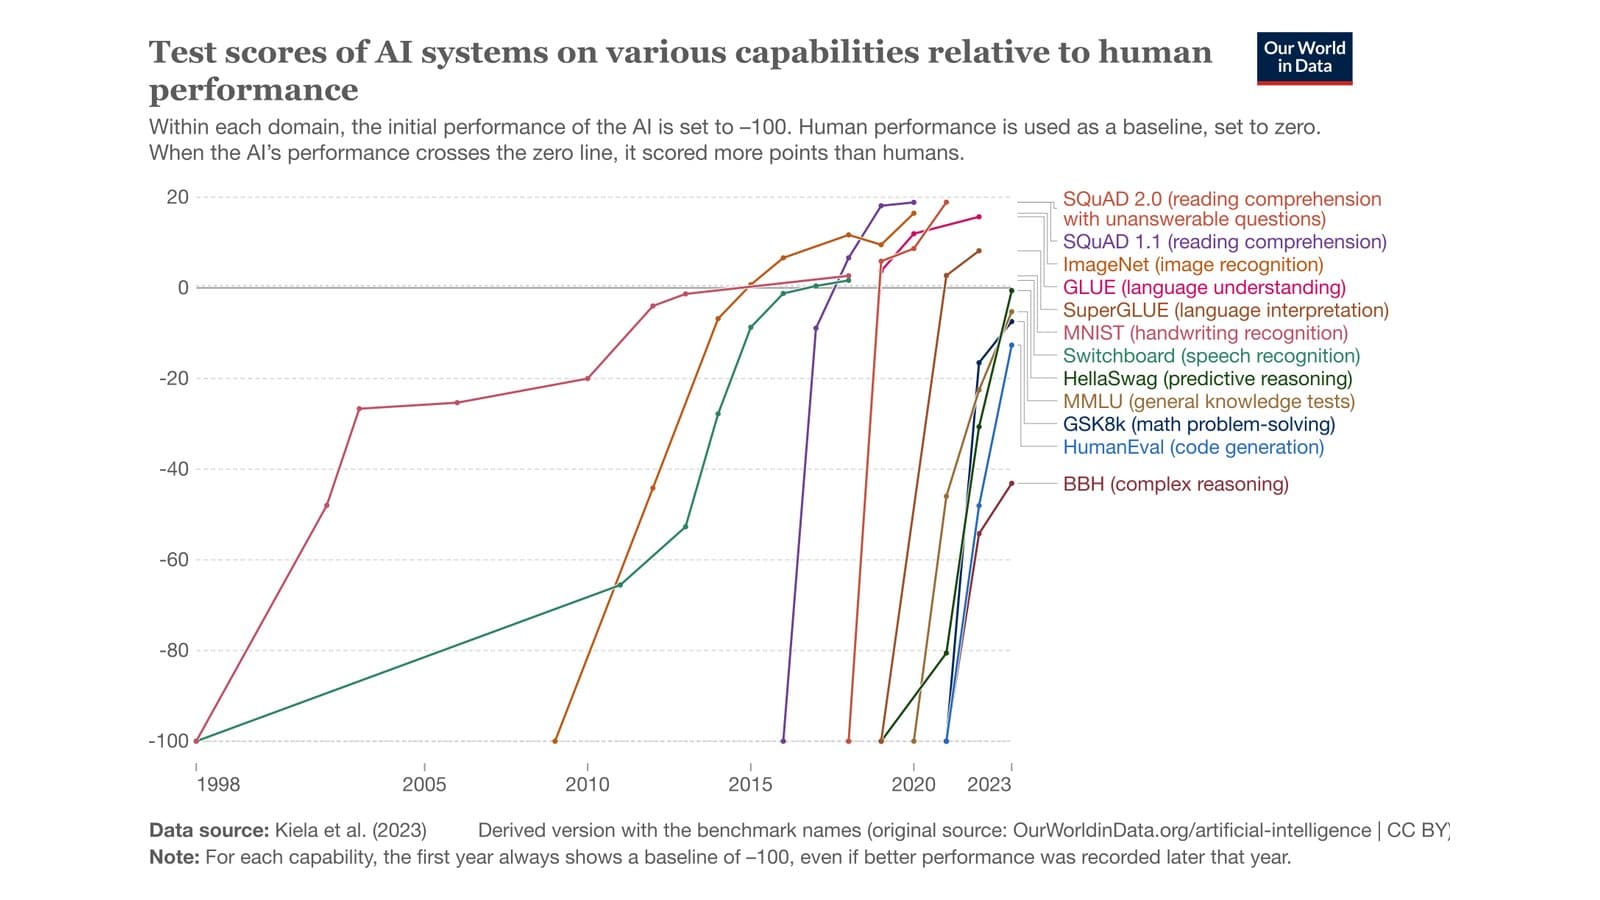
Chart: Alenoach via Wikimedia Commons, CC BY 4.0, derived from Our World in Data using data from Kiela et al. (2023). Every line starts at minus 100 and crosses zero when the machine passes the human baseline. Notice how the lines get steeper the later they start.
What Is an AI Benchmark?
An AI benchmark is a fixed set of tasks with known correct answers, used to compare different systems under identical conditions. MMLU asks 57 subjects worth of multiple-choice exam questions. SWE-bench hands a model 2,294 real GitHub issues and checks whether the repository's own tests pass afterward. The benchmark is the questions plus the scoring rule plus the leaderboard that publishes results.
Benchmarks exist because "this model feels smarter" is not a claim anyone can check. A shared test lets two labs on two continents compare work. That coordination function is why benchmarks drove so much progress, and the reason they keep failing is baked into the same mechanism: the moment a number becomes the target, it stops being a measurement. For the plain-English definition of the practice, see evals and agent evaluation.
The Master Timeline of AI Benchmarks
The single most useful view of this history is the lifespan column. Every benchmark listed below was, at launch, considered hard enough to last. Almost none of them lasted.
| Year | Benchmark | What it measured | Best score at launch | Where it stands now |
|---|---|---|---|---|
| 1950 | Turing's imitation game | Whether a machine could pass as human in conversation | No system existed | A thought experiment, never a scored dataset |
| 1992 | NIST TREC | Text retrieval quality over a shared document collection | Early IR systems | Still running annually, now an evaluation venue |
| 1998 | MNIST | Handwritten digit recognition | Roughly 99 percent for the best convolutional nets | Solved; used to teach, not to rank |
| 2009 | ImageNet | Object recognition over 1,000 categories | Roughly 72 percent top-5 in 2010 | Human level passed by 2015, challenge ended 2017 |
| 2016 | SQuAD | Reading comprehension over Wikipedia passages | Well below human | Passed by models; replaced by SQuAD 2.0, then retired |
| 2018 | GLUE | Nine language understanding tasks | Below human baseline | Passed non-expert humans within about a year |
| 2019 | SuperGLUE | Harder language understanding tasks | Built to restore headroom | Headroom gone within roughly two years |
| 2019 | HellaSwag | Commonsense sentence completion | Humans above 95, models below 48 | Effectively solved |
| 2019 | ARC-AGI | Novel visual reasoning with no training shortcut | Near 0 percent | Broken through in 2024; replaced by ARC-AGI-2 |
| 2020 | MMLU | 57 academic and professional subjects | Most models near random | Saturated; now a floor check, not a ranking |
| 2021 | HumanEval | Writing Python functions from docstrings | 28.8 percent pass@1 for Codex | Routine for frontier models; superseded |
| 2021 | GSM8K | Grade-school word problems | Far below human | Solved, and later shown to be partly memorized |
| 2022 | BIG-bench | 204 tasks from 450 authors at 132 institutions | Broadly below human | Survives mainly as the BIG-Bench Hard subset |
| 2022 | HELM | 42 scenarios scored on 7 metrics at once | Not a single number by design | Still maintained; the template for holistic evaluation |
| 2023 | Chatbot Arena | Human preference between two anonymous replies | 9 models at launch | Still the default vibe check, with known distortions |
| 2023 | GPQA | 448 graduate-level science questions | PhD experts 65, best model 39 | Cleared by frontier reasoning models |
| 2023 | SWE-bench | Fixing 2,294 real GitHub issues | 1.96 percent solved | Still central, via the Verified subset |
| 2023 | GAIA | 466 real assistant tasks needing tools and browsing | Humans 92, model with plugins 15 | Still hard for generalist agents |
| 2024 | tau-bench | Following business policy across a real conversation | Under 50 percent, reliability under 25 | The reliability gap it exposed is still open |
| 2024 | FrontierMath | Original research-grade mathematics | Under 2 percent solved | Still one of the hardest public tests |
| 2025 | Humanity's Last Exam | 2,500 expert questions from 1,000+ contributors | Low accuracy across the board | Climbing faster than its authors expected |
| 2025 | ARC-AGI-2 | Harder novel reasoning, scored against cost | Near 0 at launch | Top open competition entry hit 24.03 percent in 2025 |
| 2025 | Terminal-Bench | Real work inside a command line sandbox | Low single and double digits | Active; the current agent proving ground |
How the Benchmark Cycle Actually Works
Every benchmark on that list followed the same four-step loop, and the loop has been getting faster. A 2022 study in Nature Communications by Ott and colleagues mapped 3,765 benchmarks across 947 AI tasks and found that a large fraction moved rapidly toward saturation or stagnation, with results heavily concentrated in a small number of popular datasets: the top 22 percent of natural language datasets produced as many published results as every other dataset combined.
The clearest documented example is GLUE. It was published on 20 April 2018 as a nine-task suite for language understanding. When the same team published SuperGLUE on 2 May 2019, their own abstract explained why: "performance on the benchmark has recently surpassed the level of non-expert humans, suggesting limited headroom for further research." Roughly twelve months from state of the art to obsolete, written by the authors themselves.
The First Era: From a Thought Experiment to a Scored Dataset
Machine intelligence had no numeric measure for its first four decades. Alan Turing opened "Computing Machinery and Intelligence" in the October 1950 issue of Mind with the question "Can machines think?" and immediately replaced it with the imitation game, because he judged the original question too ill-defined to answer. That instinct, to swap a vague question for an operational one, is the founding move of the entire benchmark tradition.
What Turing did not provide was a dataset. That came from the 1990s, when the US National Institute of Standards and Technology began running shared evaluations for speech recognition and text retrieval, and when Yann LeCun and colleagues released MNIST in 1998 as a standard set of handwritten digits. MNIST is the earliest entry on the chart at the top of this article, and it took roughly a decade of steady work before machines passed the human line on it.
Compare that to the benchmarks released after 2019, most of which were passed within two or three years. The slope of the lines in that chart is the real story of the last decade of machine learning.
ImageNet: The Benchmark That Started the Boom
ImageNet is the clearest case of a benchmark changing the field rather than just measuring it. Released in 2009 and run as the ImageNet Large Scale Visual Recognition Challenge from 2010 to 2017, it asked systems to classify photographs into 1,000 categories.
In 2012 an entry from Alex Krizhevsky, Ilya Sutskever, and Geoffrey Hinton reported a top-5 error rate of 15.3 percent against 26.2 percent for the second-best entry. A gap that large in a mature competition is not an improvement, it is a different method. That entry was a deep convolutional neural network trained on GPUs, and its win is the conventional starting point of the modern deep learning era.
By 2015 the winning error rates had dropped below the roughly 5 percent that human annotators achieved on the same task. The challenge ran for two more years and then stopped. This is the pattern in its healthiest form: a benchmark posed a real problem, the problem got solved, and the organizers had the discipline to retire it rather than keep publishing a leaderboard where everyone scored the same.
The Exam Era: MMLU and the Rise of the Multiple-Choice Score
MMLU set the template for how language models are marketed. Dan Hendrycks and colleagues published "Measuring Massive Multitask Language Understanding" on 7 September 2020, covering 57 subjects from elementary mathematics to professional law. At the time, most models scored near random, and the largest available model managed roughly 20 points above chance.
Within four years it had become the number on every launch slide, and then it stopped meaning anything. Two things happened at once. First, scores compressed at the top, so the difference between a very good model and the best model fell inside the range you would expect from noise. Second, people audited the questions. A June 2024 paper titled "Are We Done with MMLU?" found errors in 6.49 percent of MMLU questions overall, and in 57 percent of the sampled questions in the Virology subset. The authors released a corrected set of 5,700 re-annotated questions.
Read that carefully. For several years, part of the industry's headline measure of "does this model know things" was scoring models against wrong answers.
The same era produced the counter-movement. HumanEval arrived in July 2021 with 164 hand-written Python problems, graded by running the code rather than matching strings, and at publication the best system passed 28.8 percent on a single attempt. BIG-bench arrived in June 2022 with 204 tasks contributed by 450 authors across 132 institutions, on the theory that breadth would delay saturation. And in November 2022 Stanford's Center for Research on Foundation Models published HELM, which scored 30 models across 42 scenarios on 7 metrics including calibration, robustness, bias, and efficiency. HELM's most damning finding was procedural: before it existed, models had on average been evaluated on only 17.9 percent of its core scenarios, and some prominent models shared no evaluation scenario at all. Nobody was comparing like with like.
Benchmark Contamination: Why Leaderboard Claims Are Hard to Trust
Contamination is when benchmark questions or answers end up inside a model's training data. The model then recalls rather than reasons, and the score goes up without the capability going up. This is the single most important thing to understand about published AI scores, and it is not a fringe concern.
| Contamination type | What it looks like | Why filters miss it | Documented evidence |
|---|---|---|---|
| Verbatim leak | Exact test items appear in the training corpus | Nothing, this is the case n-gram filters catch | Standard decontamination reports in model cards |
| Rephrased leak | Test items paraphrased or translated before training | Filters match strings, not meaning | Yang et al. 2023: a 13B model reached scores on par with far larger models |
| Repository familiarity | The model saw the codebase, not the test itself | The benchmark item is novel, the context is not | SWE-Bench Illusion 2025: 76 percent file-path accuracy inside the benchmark, 53 percent outside |
| Style overfitting | Trained on data shaped like the benchmark | No leak exists to detect | GSM1k 2024: drops of up to 8 percent on a matched-difficulty rebuild |
| Benchmark errors | The answer key itself is wrong | Not contamination, but corrupts the same number | MMLU audit 2024: 6.49 percent error rate overall |
Three of those deserve to be read in full.
In November 2023, Shuo Yang and colleagues published "Rethinking Benchmark and Contamination for Language Models with Rephrased Samples". They showed that simple paraphrasing or translation of test items defeats standard n-gram decontamination, and that a 13-billion-parameter model trained on rephrased test sets could reach performance on par with a frontier model of the day across MMLU, GSM8k, and HumanEval. A small model can look like a big model if you feed it the right disguised answers.
In May 2024, a team at Scale AI published "A Careful Examination of Large Language Model Performance on Grade School Arithmetic". They rebuilt GSM8K from scratch as GSM1k, matched for style, difficulty, and human solve rate, and re-ran the field. Accuracy fell by up to 8 percentage points, with several model families showing systematic overfitting across nearly all sizes. Notably, the strongest frontier models showed minimal signs of it, which is the honest nuance: contamination is real and it is uneven.
In June 2025, researchers at Microsoft published "The SWE-Bench Illusion". They asked models to identify which file contained a bug given only the issue description, with no access to the repository. Models got it right up to 76 percent of the time on SWE-bench repositories and only up to 53 percent on comparable repositories outside the benchmark. Function reproduction showed the same asymmetry, with far higher verbatim similarity inside the benchmark than outside. A meaningful part of a headline coding score can be familiarity with twelve specific open-source projects.
The structural problem is that a benchmark has to be public to be useful and has to be private to stay honest. Every attempted fix trades one against the other: hold out a private test set and nobody can reproduce your result, refresh the questions continuously as LiveBench does and you lose year-over-year comparability. There is no clean answer, only tradeoffs. This is also why a model's knowledge cutoff and what sits in its parametric knowledge matter so much when you read a score.
The Arena Era: Human Preference and Its Own Distortions
When multiple-choice tests stopped separating models, the field turned to human preference. Chatbot Arena launched on 3 May 2023 with nine models, anonymous randomized head-to-head battles, and an Elo rating borrowed from chess. It answered a question no exam could: which model do people actually prefer talking to?
Automating that judgment came next. In June 2023 the same group published "Judging LLM-as-a-Judge with MT-Bench and Chatbot Arena", reporting that a strong judge model agreed with human preferences more than 80 percent of the time, roughly the rate at which humans agree with each other. That result is why LLM-as-a-judge is now standard practice in production eval pipelines, including for agent evaluation.
Both approaches carry distortions worth naming. Preference voting rewards answers that look good, which is a different thing from answers that are correct, and it is one mechanism by which sycophancy gets selected for. And in April 2025 a large multi-institution analysis titled "The Leaderboard Illusion" documented structural asymmetries in the arena itself: undisclosed private testing that let some providers evaluate many variants and publish only the best, an estimated 19.2 percent and 20.4 percent of all arena comparison data flowing to two large providers, and 83 open-weight models sharing roughly 29.7 percent between them. The paper estimated that access to that extra data was worth relative gains of up to 112 percent on the arena distribution.
None of that requires anyone to cheat. It only requires that the people who can afford the most attempts get the most attempts.
The Agentic Turn: Grading Finished Work Instead of Answers
The most important shift in benchmark design happened around 2023, when the question changed from "does the model know the answer" to "did the system actually complete the job." This matters because the thing being evaluated stopped being a model and became a model plus an agent harness: tools, retries, file access, and a loop.
| Benchmark | Published | What it grades | Result at publication |
|---|---|---|---|
| SWE-bench | Oct 2023 | Patches for 2,294 real GitHub issues across 12 Python repos | Best system solved 1.96 percent |
| GAIA | Nov 2023 | 466 assistant tasks needing browsing, files, and multi-step reasoning | Humans 92 percent, a leading model with plugins 15 percent |
| tau-bench | Jun 2024 | Following domain policy across a simulated customer conversation | Under 50 percent success, and under 25 percent consistency over 8 runs |
| SWE-bench Verified | Aug 2024 | A human-validated 500-task subset of SWE-bench | 68.3 percent of original samples were filtered out as flawed |
| Terminal-Bench | May 2025 | End-to-end work inside a real command line sandbox | Low scores at launch, refreshed to 89 verified tasks in Nov 2025 |
Two of those numbers deserve emphasis.
SWE-bench Verified exists because the original benchmark was partly broken. When OpenAI worked with the SWE-bench authors to have human engineers review every instance, 38.3 percent of samples were flagged for underspecified problem statements and 61.1 percent for unit tests that could reject a valid fix. In total 68.3 percent of the original samples were filtered out. Every SWE-bench score published before August 2024 was measured partly against unsolvable problems.
And tau-bench measured something almost nobody else did: consistency. It introduced a metric for passing the same task on all of eight independent attempts, and reported that a leading function-calling agent stayed under 25 percent on that measure in the retail domain. A system that succeeds half the time and succeeds reliably are different products, and only one of them can be put in front of customers. That gap is why non-determinism and error recovery matter more than a headline percentage.
How to Read Any Benchmark Claim
Here is the practical version. When you see a score, four numbers are usually missing, and they are the ones that decide whether the score means anything.
  A BENCHMARK CLAIM                         WHAT IT LEAVES OUT
  ─────────────────────────────────────────────────────────────────────────
  "72% on SWE-bench Verified"        →      Which harness? Tools? Retries?
                                            Same scaffold as the comparison?  "Beats the leading model on MMLU"  →      By how much? Inside noise?
Which of the 57 subjects moved?
  "State of the art on ARC-AGI"      →      At what cost per task?
$2 or $4,000 is the whole story.
  "Human-level performance"          →      Which humans? Experts or crowd?
Measured how, on which subset?
  "#1 on the leaderboard"            →      Self-reported or reproduced?
How many private attempts first?
─────────────────────────────────────────────────────────────────────────
RULE OF THUMB: a score without a harness, a cost, and a date
is a press release, not a measurement.
The cost column is not a footnote. In December 2024 the ARC Prize team reported that a frontier reasoning model reached 75.7 percent on the ARC-AGI semi-private set at roughly 26 dollars per task, and 87.5 percent when given about 172 times more compute at roughly 4,560 dollars per task. Both are true. Only one of them describes something you could deploy. This is why reasoning effort and test-time compute now belong in any serious comparison, and why cost per completed task is the number operators actually track.
The Frontier: Benchmarks Built to Survive
The current generation of benchmarks is designed with saturation in mind from day one.
ARC-AGI came from Francois Chollet's 2019 paper "On the Measure of Intelligence," which argued that skill is not intelligence because "unlimited priors or unlimited training data allow experimenters to buy arbitrary levels of skill." His alternative definition, skill-acquisition efficiency, is why ARC scores are always reported alongside cost. ARC-AGI-1 moved from roughly 0 percent with a 2020 model to about 5 percent in early 2024, then broke open in December 2024. ARC-AGI-2 followed in May 2025 with harder tasks and an explicit efficiency dimension. In the ARC Prize 2025 results published on 5 December 2025, the top open competition entry from 1,455 teams reached 24.03 percent, while commercial systems reached 37.6 percent at about 2.20 dollars per task and 54 percent at about 30 dollars per task. Six years after publication, the benchmark still has room.
FrontierMath, published by Epoch AI in November 2024, took the other route: original, unpublished research-grade mathematics problems that cannot be contaminated because they have never been on the internet. At publication, state-of-the-art models solved under 2 percent.
Humanity's Last Exam, published in January 2025, pooled 2,500 expert questions from more than a thousand contributors, explicitly because models were exceeding 90 percent on the popular benchmarks of the day.
And the newest response to saturation is to stop relying on any single benchmark. Epoch AI's Capabilities Index combines results from more than 50 distinct benchmarks into one scale using item response theory, the same statistical machinery used to compare students who sat different exams in different years. Models score higher for doing well on benchmarks that other capable models find hard, and benchmarks are rated as hard because capable models fail them. It has no maximum, so it does not saturate in the way an individual test does.
What This Means If You Are Choosing an AI Tool
Public benchmarks tell you which models are broadly capable. They cannot tell you whether a system does your job, because your job is not on any leaderboard.
The practical replacement is your own eval set, and it is much smaller than people expect. Twenty to fifty real tasks, each with a written expected result, run identically against every model and prompt change. Group them into normal cases, edge cases, and the awkward inputs that broke things last month. Every production failure becomes a permanent test case. This is the whole method, and it is covered in depth in AI agent evals explained.
| Question you actually have | Public benchmark | Your own eval set |
|---|---|---|
| Is this model broadly competent? | Yes, this is what they are for | Overkill |
| Will it handle my company's tickets? | No | Yes |
| Did my prompt change help or hurt? | No | Yes |
| Is it consistent across repeated runs? | Rarely measured | Yes, run each case several times |
| What does one completed task cost? | Almost never published | Yes, measure it directly |
| Did the last model update break anything? | No | Yes, this is the main use |
The single highest-value habit is running the same fixed set after every model or prompt change. Models drift, providers ship updates, and the only way to notice a quiet regression before your customers do is to have a number you check every time. Pair that with agent observability so you can see which step failed, not just that something did.
Running Your Own Comparison Inside a Workspace
The reason benchmark shopping is frustrating is that it forces a permanent decision from temporary information. A better setup keeps the model swappable.
That is how Taskade approaches it. You get frontier models from top AI labs, and you can change the model behind an AI agent without rebuilding the agent, its instructions, or its knowledge. Run the same brief through three models, compare the actual output on your actual work, and keep the one that wins. That is a real eval, done on the only test set that matters.
The rest of the loop lives in the same workspace. Agents draw on project knowledge as persistent memory, so the comparison runs against your real context rather than a generic prompt. Automations with triggers and actions across 100+ bidirectional integrations let you run the same task repeatedly on a schedule, which is how you catch the consistency problem tau-bench measured. And because everything renders in one of multiple project views, including Table and Board, an eval run is just a project you can sort and filter.
If you would rather start from something that already works, the Community Gallery has live apps built with Taskade Genesis you can open, inspect, and adapt. Building your own custom agent takes a prompt. Paid plans start at $10 per month billed annually, and the pricing page has the full breakdown.
Frequently Asked Questions
What was the first AI benchmark?
The first widely discussed test of machine intelligence was the imitation game proposed by Alan Turing in his 1950 paper "Computing Machinery and Intelligence" in Mind. It was a thought experiment, not a scored dataset. Benchmarks in the modern sense arrived in the 1990s with NIST evaluations for speech and retrieval, and with MNIST for handwritten digits in 1998.
Why do AI benchmarks stop working?
They saturate. Once a benchmark becomes the number everyone optimizes for, models are trained specifically to do well on it and scores cluster near the ceiling where they no longer separate systems. GLUE was published in April 2018, and its own authors reported that performance had passed non-expert human level when they released SuperGLUE about twelve months later.
What is benchmark contamination?
Contamination is when test questions or answers end up inside a model's training data, so the model recalls instead of reasoning. A 2023 study showed that paraphrasing or translating test items lets them slip past standard n-gram filters, and that a 13-billion-parameter model trained on rephrased test sets could reach scores on par with far larger models.
Is MMLU still a useful benchmark?
As a floor check, yes. As a ranking, no. Frontier scores compressed near the top of the scale by 2024, and a June 2024 audit found errors in 6.49 percent of questions overall and 57 percent of the sampled Virology subset. Treat a high MMLU score as table stakes.
What is LLM-as-a-judge and can you trust it?
It uses a language model to grade another model's output against a rubric. The 2023 MT-Bench paper reported over 80 percent agreement with human preferences, roughly the rate humans agree with each other. It scales well but inherits biases, such as preferring longer answers, so calibrate it against human-labeled examples and spot-check a sample.
What is SWE-bench and why does it matter?
SWE-bench, published in October 2023, contains 2,294 real GitHub issues from 12 Python repositories. A system has to produce a patch that makes the repository's real tests pass. At publication the best model solved 1.96 percent. It matters because it grades finished work instead of multiple-choice answers.
Are AI leaderboards rigged?
Not usually rigged, but shaped by who can afford to play. An April 2025 analysis reported that some providers could test many private variants before publishing a score, that two large providers accounted for roughly 19 and 20 percent of all arena comparison data, and that 83 open-weight models shared about 30 percent. Most leaderboard rows are also self-reported rather than independently reproduced.
What is ARC-AGI and why is it different?
It comes from Francois Chollet's 2019 paper "On the Measure of Intelligence" and tests solving novel visual puzzles rather than recalling facts. In December 2024 a frontier reasoning model reached 75.7 percent on the semi-private set at about 26 dollars per task, and 87.5 percent with roughly 172 times more compute at about 4,560 dollars per task. The cost spread is the finding.
How should a business evaluate an AI model or agent?
Build your own eval set. Collect 20 to 50 real tasks, write the expected result for each, and score every model or prompt change against that fixed set. Add every production failure as a permanent case. Public benchmarks tell you which models are broadly capable. Only your own set tells you whether one does your job.
Which benchmarks matter most in 2026?
The ones that grade completed work under realistic conditions: SWE-bench Verified for code repair, GAIA and tau-bench for tool-using assistants, Terminal-Bench for command line agents, ARC-AGI-2 for novel reasoning, and FrontierMath and Humanity's Last Exam for expert problems. Composite indices pooling 50 or more benchmarks are increasingly used because any single test saturates within a year or two.
Does Taskade let you compare different AI models?
Yes. You get frontier models from top AI labs, and you can switch the model behind an agent without rebuilding it. That makes running the same task through several models practical, so you can judge on your own work. Paid plans start at $10 per month billed annually.
Why do two sources report different scores for the same model and benchmark?
Because the score depends on the scaffolding, not just the model. Prompt format, attempts allowed, tool access, retry logic, and benchmark version all move the number. A June 2025 study found a model could identify the correct buggy file from an issue description alone 76 percent of the time on SWE-bench repositories and 53 percent on repositories outside it.
The Measurement Problem Never Gets Solved
Seventy-six years after Turing swapped "can machines think" for a question you could actually run, the field is still swapping questions. MNIST gave way to ImageNet, ImageNet to GLUE, GLUE to MMLU, MMLU to SWE-bench, SWE-bench to ARC-AGI-2 and whatever replaces it next year. Each generation of benchmark was built to last and got eaten.
That churn is not failure. It is what progress looks like when the thing you are measuring keeps moving. The mistake is treating any single number as a verdict rather than a snapshot with a date, a harness, and a cost attached.
For the work in front of you, the honest measure has always been the same one: give the system a real task, look at what it produced, and decide whether you would ship it. That is what Taskade Genesis is built around. Your projects hold the memory, your agents supply the intelligence, and your automations carry out the execution, so the loop that produces your work is the same loop you evaluate.
Stop reading leaderboards. Start running your own.
▲ ■ ●
Further Reading
Evaluation and Agents
- AI Agent Evals Explained: task success, trajectory, LLM-as-judge, and how to build an eval set
- The TSK-1 Methodology: a benchmark that grades the finished app instead of the score
- Best AI Model for Building Apps in 2026: nine models, one prompt, every result dated
- RL Environments Explained: how models are now trained on graded real work
- Evals: the plain-English definition
- Agent Evaluation: measuring an agent, not just a model
- Agent Observability: seeing which step failed
- Non-Determinism: why the same prompt gives different answers
- AI Agent Error Recovery: what happens after a step fails
- Self-Improving AI Agents: reflection loops in practice
- Human in the Loop: where a person still signs off
How the Models Work
- How Do Large Language Models Work?: attention to generation
- Reasoning Models and Test-Time Compute: why cost per task varies so much
- Scaling Laws: the relationship benchmarks were built to track
- Chain of Thought: the technique that moved the math benchmarks
- Context Engineering: what you put in front of the model
- What Is Mechanistic Interpretability?: looking inside instead of scoring outside
- What Is Grokking in AI?: when a model suddenly generalizes
History Series
- The History of Anthropic and Claude
- The Complete History of GitHub
- The History of Workflow Automation
- History of Mermaid.js
- Metacognitive AI: from Flavell to reflection loops
- AI World Models Explained
Explore Taskade
- Taskade Genesis: one prompt, one living app
- AI Agents: swap models without rebuilding the agent
- Automations: triggers and actions across 100+ integrations
- Community Gallery: real apps you can open and adapt
- Pricing: Pro starts at $10/mo billed annually