





Search "AI ops dashboard builder" and you will find two crowds colliding. One wants prettier charts on warehouse metrics. The other typed "free AI app builder," clicked through a dozen vibe-coding tools, and still does not have a board their team will open on Monday. This post is for both, and especially for the second crowd: people trapped in demo apps that look alive in the preview and die in production.
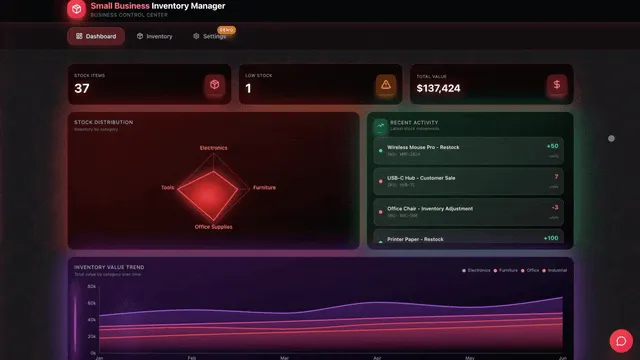
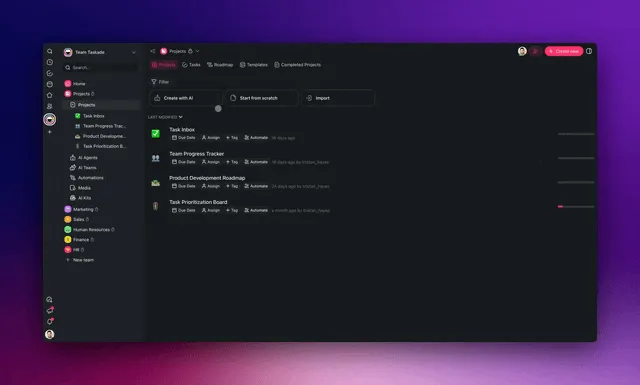
Taskade Genesis is not a charting library with a chatbot. It is a prompt-to-ops path: Projects as memory, Agents as intelligence, Automations as execution, App UI as the interface. Charts can exist. Charts are not the product. The product is an ops dashboard that changes when work changes.
TL;DR: Most "AI dashboards" stop at charts. Most "free AI app builders" stop at UI demos. Taskade Genesis is for ops dashboards that own the work underneath the numbers. Start with the prompt-to-ops dashboard builder, read the sibling guides on ops dashboard builders, free AI app builders, and from AI app builder to ops system, then ship something your team will actually update.
Why free AI app builders trap operators
Free AI app builders win screenshots. They lose weeks. The pattern is consistent:
- You prompt a sleek dashboard.
- The preview shows cards, charts, and fake rows.
- You invite a teammate.
- Nobody knows where real data lives.
- You paste CSV once, then go back to Sheets.
- The "app" becomes a graveyard tab.
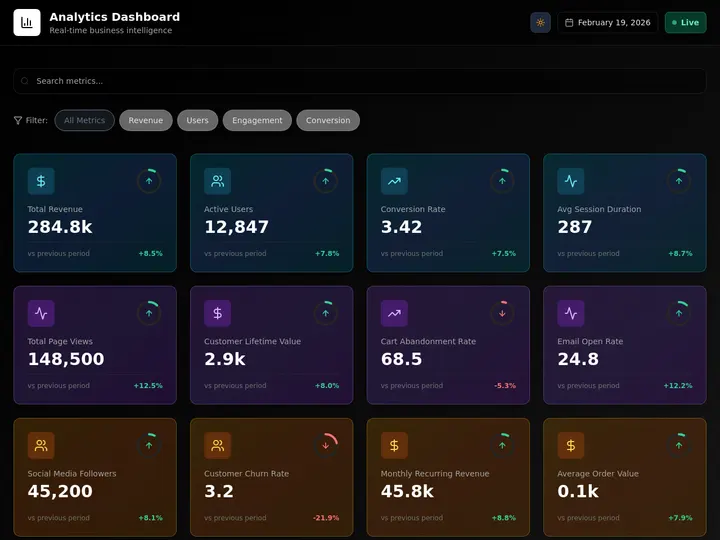
That is not a moral failure of vibe coding. It is a category confusion. An app UI without memory, agents, and automations is a poster. An ops dashboard without a write path is a museum exhibit of last Thursday.
| Builder promise | What operators need | Failure mode |
|---|---|---|
| Pretty UI in minutes | Status someone updates daily | Demo data forever |
| Chart widgets | Decisions tied to open work | Vanity metrics |
| "Connect any data" | One system of record | Five fragile connectors |
| Unlimited remixes | One trusted board | Prompt sprawl |
| Free forever | Durable workflows | Soft paywalls mid-flight |
If you arrived here after trying a few free builders, you are not behind. You are early to the real question: what must the dashboard do?
Ops dashboard vs analytics dashboard
Say the difference out loud.
- Analytics dashboard: reads warehouses, BI tools, product metrics. Optimized for questions like "what happened last quarter?"
- Ops dashboard: reads and writes the work. Optimized for questions like "what is stuck, who owns it, what fires next?"
Taskade Genesis is built for the second. It can embed light charts, but it does not replace Looker, Power BI, or a full observability stack — keep those for warehouse analytics and pair them with the ops board.
Table: which dashboard are you buying?
| Signal | Analytics tool | Ops dashboard in Taskade Genesis |
|---|---|---|
| Primary user | Analyst / leadership | Operator / lead / owner |
| Write back to work? | Rarely | Required |
| Freshness | Batch / warehouse lag OK | Minutes to hours |
| AI role | Explain charts | Act on exceptions |
| Success metric | Insight adopted in a meeting | Queue cleared today |
The prompt-to-ops loop
A good ops dashboard prompt is not "make me a dashboard with 8 charts." It is a story of work:
- What arrives (tickets, jobs, leads, incidents)?
- What states does it move through?
- Who must see it at each state?
- What should happen automatically?
- What should an agent draft or flag?
Generate that spine with the prompt-to-ops dashboard builder. Then reshape fields in chat until the board matches how your team already talks.
Bridge from free AI app builders
If you already generated three dead demos elsewhere, do not throw the learning away. Extract it.
| Artifact from dead demo | Bring into Taskade Genesis as... |
|---|---|
| Fake KPI cards | Real rollups on Project fields |
| Sample table columns | Schema for work records |
| Pretty status colors | Status enum + automations |
| Chatbot sidebar | Agent with tools on the board |
| Screenshot of "dream UI" | Prompt constraints for first generate |
Read free AI app builders for the trap taxonomy, then from AI app builder to ops system for the category jump. This post is the practical middle: build the ops dashboard, not another chart collage.
What to put on the board (and what to leave off)
Put on
- Open work by state
- Owners and aging
- Blockers / exception queue
- Today's commitments
- Agent digest of risks
- Links to the underlying record (not a second copy)
Leave off
- Executive vanity charts with no owner
- Warehouse metrics you already have in BI
- Live GPS maps — Taskade Genesis does not do fleet tracking or offline truck apps. Pair a telematics tool for location and keep the board focused on the office side: dispatch, status, and customer history.
- Fake social proof tiles
- LMS course progress — a learning platform handles this better
- IDX listing feeds — a real-estate listing platform handles this better
| Widget temptation | Ops-safe replacement |
|---|---|
| 12-line revenue chart | Open invoices / jobs aging list |
| Heatmap of everything | Top 10 exceptions |
| Live map of trucks | Status + ETA notes from humans or telematics export |
| AI "insights" carousel | One agent digest with actions |
Comparison: chart tools, vibe builders, Taskade Genesis
| Approach | Strength | Weakness | Choose when |
|---|---|---|---|
| BI / charts (Looker, Metabase, etc.) | Deep analytics | Weak write-back to ops | Leadership reporting |
| Free AI app builders | Fast UI demos | Thin memory / ops durability | Exploration only |
| Internal tools (Retool-class) | Strong admin UIs | Heavier build cost | Eng-owned internals |
| Softr / Glide-class | Portal UI on data | Skin vs system risk | External UI on existing DB |
| Taskade Genesis | Living ops + agents | Not a BI warehouse | Operator dashboards you own |
More context lives in ops dashboard builders.
Decision tree
Choose Taskade Genesis if...
- The dashboard is a morning cockpit for people who move work.
- You want an agent to summarize exceptions, not only plot them.
- You escaped free builders and want durability.
Choose something else if...
- You need pixel-perfect BI with semantic layers.
- You only need a read-only TV dashboard in the hallway.
- You need GPS fleet tracking, course delivery, or IDX listing feeds as core modules — those belong in purpose-built tools.
Migration / build playbook
- Write the five-question prompt (arrivals, states, viewers, automations, agent jobs).
- Generate via /generate/dashboards/prompt-to-ops.
- Delete half the widgets. Seriously. Fewer tiles, more trust.
- Connect the write path. Every card should deep-link to a record someone can edit.
- Add one automation (notify on status change) before you add a fifth chart.
- Add one agent that posts a morning digest.
- Run a five-day ritual. If the board is stale on day three, fix ownership, not colors.
| Day | Focus | Done means |
|---|---|---|
| 1 | Generate + prune | <= 6 primary views |
| 2 | Schema cleanup | Fields match team language |
| 3 | Automation #1 | Status change notifies owner |
| 4 | Agent digest | Morning summary in chat or note |
| 5 | Team trial | Two operators update without you |
Example ops dashboards (prompt angles)
| Team | Ops question | Board emphasis |
|---|---|---|
| Home services | Which jobs are stuck before parts? | Dispatch aging + blocker tags |
| Agency | Which retainers are quiet-angry? | Client health + open feedback |
| Maintenance | Which PMs slip this week? | PM due + open WOs |
| Ops lead | What broke overnight? | Exception queue + owner |
Each can start from the same generator. Reshape; do not collect twelve unrelated apps.
Honest boundaries
| Overclaim | Reality |
|---|---|
| "Replace your entire BI stack" | No. Pair BI for analytics. |
| "Free forever unlimited AI" | Free plans exist; usage has limits. See plan pages at /create. |
| "Auto-sync every SaaS perfectly" | Prefer one system of record; integrations are deliberate. |
| "GPS / LMS / IDX included" | No. Taskade Genesis covers the office side — dispatch boards, customer history, client portals — not fleet tracking, course delivery, or listing feeds. |
| Big customer counts as proof | We quote no market-share or install stats here, because we would rather you judge the board your team builds this week. |
A concrete morning: before and after
Before (chart poster): The lead opens a dashboard with seven charts. Revenue looks fine. Ticket volume is "up and to the right." Nobody can see the three jobs waiting on parts, the one angry client in email, or the PM that slipped yesterday. The meeting becomes a scavenger hunt across inbox, chat, and Sheets.
After (ops cockpit): The lead opens one board. Exceptions are sorted by age. Owners are named. An agent digest lists the top five risks in plain language. One automation already nudged the parts blocker yesterday. The meeting is fifteen minutes because the work is visible.
| Moment | Chart poster behavior | Ops cockpit behavior |
|---|---|---|
| 8:55am | Refresh BI, shrug | Open exceptions queue |
| 9:10am | Ask "who owns this?" in chat | Owner field already set |
| 9:40am | Take screenshots for standup | Share board link |
| 4:00pm | Wonder what slipped | Aging column answers |
That is why chart builders and free app builders are really answers to the same question. People do not want more pixels. They want Monday to hurt less.
Prompt sketch you can paste
Use language like this when you generate:
Build an ops dashboard for a five-person team. Show open work by status, owner, and age. Include an exceptions queue for blocked items. Add a morning agent digest of the top risks. Notify owners when status changes. Do not add vanity revenue charts. Do not add GPS maps.
Then prune anything the generator adds that your team will not update daily.
FAQ
Is this just another AI dashboard builder?
If "dashboard" means charts, no. If it means an ops cockpit with memory and agents, yes. Start at the prompt-to-ops dashboard builder.
I came from free AI app builders. Will this feel the same?
The generate step will feel familiar. The durability will not, if you commit to Projects as the system of record. Read from AI app builder to ops system.
Can I keep Sheets as the database?
You can import and dual-run. Long-term, Sheets-as-master recreates the demo trap. See also migration patterns in related dispatch posts when your "dashboard" is really a job log.
Do I need engineers?
No for the first board. Yes if you later need warehouse-grade analytics or custom infra. Do not hire eng to rebuild a status board you can generate.
Where should I go next?
/create, the generator above, then the deeper reads: ops dashboard builders and free AI app builders.
How much does an ops dashboard cost?
Taskade has a Free plan at $0, Pro at $10 per month billed annually or $20 month-to-month, and Business at $25 per month billed annually or $50 month-to-month. New accounts also get a one-time 6,000 credit grant: 1,000 at signup plus 5,000 with your first build. Start the first board on Free, prune it, then decide which plan you actually need.
Related reading order
- Skim free AI app builders if you are escaping demos.
- Read from AI app builder to ops system for the category shift.
- Use ops dashboard builders when you compare tool classes.
- Generate with the prompt-to-ops dashboard builder and ship the ritual.
CTA
Stop shipping chart posters. Generate a living ops dashboard with the prompt-to-ops dashboard builder, create your workspace at /create, and make the first metric that matters a cleared queue, not a prettier pie.