



You type a question. Two seconds later, an answer. The electricity that produced it was ordered in 2021.
Interconnection queues in the United States passed four years in 2024, and only about 13% of the capacity that entered those queues between 2000 and 2020 had reached commercial operation by the end of 2025 (Lawrence Berkeley National Laboratory). The building your prompt just visited was a line item in a utility spreadsheet before the model that answered you existed. Its transformers were ordered before the chips inside it were taped out.
This post explains how AI data centers work, starting at the substation rather than the API gateway — and it ends at a token, not a terawatt-hour. Along the way we will adopt the industry's favourite metaphor, the "AI factory," and then break it on purpose, because the strangest thing about an AI data center is that almost none of the electricity comes back out as anything but heat. 🔮
TL;DR: An AI data center converts grid electricity into tokens — and into a great deal of heat. A flagship rack now draws about 120 kW, roughly six times a conventional one, which is why cooling went liquid. One median text prompt costs about 0.24–0.34 Wh, and better than 99% of that leaves the building warm rather than useful. Build an app on top of it →
⚡️ What Is an AI Data Center, and How Is It Different from a Normal One?
An AI data center is a facility built around accelerators rather than general-purpose CPUs, and the difference shows up first as power density. A general-purpose rack draws roughly 10 kW. An AI rack draws roughly 60 kW, and flagship rack-scale systems draw about 120 kW. That single ratio changes the electrical system, the cooling system, and the shape of the building.
The one number that changes everything
Density is the root cause of nearly everything else in this article. Once you put 120 kW into a cabinet you could stand next to, air stops working, the floor needs plumbing, the electrical room grows, and the site needs a substation rather than a service drop.
One honesty note that most explainers skip: the frontier is not the average. The fleet-wide deployed rack, across all the world's data centers, is still just over 11 kW (Uptime Institute). The 120 kW racks are real, growing fast, and a small minority of installed capacity. Every number in this post is more useful if you keep that distinction in view.
Why "AI data center" is a building type, not a marketing term
| Fact | Detail |
|---|---|
| What it is | A facility organised around accelerators, liquid cooling, and a high-bandwidth internal network |
| Typical AI rack | ~60 kW; flagship rack-scale systems ~120 kW |
| Typical general-purpose rack | ~10 kW |
| Fleet-wide deployed average | Just over 11 kW (Uptime Institute) |
| When liquid becomes mandatory | Above ~30 kW per rack |
| Global data-centre electricity, 2024 | 415 TWh, ~1.5% of world electricity (IEA) |
| 2030 projection | ~945 TWh (IEA) |
| Regional split, 2024 | US ~45%, China ~25%, Europe ~15% (IEA) |
| Energy per median text prompt | 0.24 Wh (Google, measured) |
| Water per median text prompt | 0.26 mL (Google, measured) |
| Cost to build | ~$10–12M/MW conventional; ~$20–30M/MW AI-optimized |
| Binding constraint | Time-to-power, not generating capacity |
Last updated: August 2026 — refreshed with Lawrence Berkeley National Laboratory's 2025 Update (published 18 June 2026), which revised US data-center electricity down to 4.7% of national consumption for 2024, and with Google's measured per-prompt figures. Energy and capex numbers in this category move every quarter, and several widely-quoted figures have been superseded by the labs that issued them. Check the IEA's Energy and AI hub before quoting any of them.
| Dimension | Traditional data center | AI data center |
|---|---|---|
| Rack power | 5–15 kW | 60–120 kW+ |
| Cooling | Air, raised floor | Liquid to the chip |
| Primary workload | Many small independent requests | Few very large synchronised jobs |
| Network fabric | Ethernet, north-south | NVLink inside the rack, InfiniBand or 800 GbE between |
| Dominant cost | Real estate and power | Accelerators |
| Siting constraint | Latency to users | Access to megawatts |
| Refresh cycle | 5–7 years | 3–5 years |
The 2026 scoreboard: five projects that define the frontier
No ranking page aggregates these, so here is the frontier as it actually stood in August 2026 — the five projects that come up in every "largest AI data center" conversation, with the operational/planned distinction that most coverage blurs:
| Project | Operator | Scale | Status, August 2026 |
|---|---|---|---|
| Stargate | OpenAI (with Oracle, SoftBank) | ~$500B program; ~7 GW planned across sites, >9 GW targeted by 2029 | Abilene, TX flagship (1.2 GW, ~450K GB200-class GPUs planned) partially live; five more US sites announced |
| Colossus | xAI | ~555K GPUs, ~$18B of silicon, ambitions toward ~2 GW | Largest operational single-site cluster; built its first 100K GPUs in 122 days |
| Hyperion | Meta | 5 GW planned, $50B+, 2,250 acres in Louisiana | Under construction; Meta's "tent" interim capacity already serving |
| Fairwater | Microsoft | 315 acres, 1.2M sq ft in Wisconsin; 72 Blackwell GPUs per rack, ~865,000 tokens/sec per rack | First phase live; 90%+ of the facility on closed-loop liquid cooling |
| Project Rainier | Amazon (for Anthropic) | ~$11B, 2.2 GW campus in Indiana | Live and scaling; custom Trainium silicon rather than GPUs |
Three things the table quietly demonstrates. The money is program-scale, not building-scale — Stargate alone is roughly the inflation-adjusted cost of twenty Manhattan Projects. The "largest" title depends entirely on whether you count operational GPUs (Colossus) or announced gigawatts (Hyperion, Stargate). And every one of the five is bottlenecked on power delivery, not chips — which is the subject of the rest of this article.
If you want the lineage of how data centers became the cloud in the first place, that story is told separately in the history of cloud computing. This post picks up where accelerators take over.
🗺️ How Does an AI Data Center Actually Work, End to End?
An AI data center works as a chain of twelve conversions: grid → substation → switchgear → transformers → UPS → busway → rack power → GPU → coolant loop → scale-up fabric → scale-out fabric → storage, with your prompt travelling in the opposite direction to the electricity and leaving as tokens. Everything else in this article is one of those links, opened up.
The twelve stops, in order
- Transmission line. Power arrives at 230–345 kV from the regional grid.
- On-site substation. Steps down to medium voltage, typically 34.5 kV.
- Medium-voltage switchgear. Splits the site into blocks and isolates faults.
- Unit substation transformers. Step down again to roughly 415 V.
- UPS and battery. Rides through the sub-second gaps; generators cover the rest.
- Busway overhead. Distributes along the row instead of under the floor.
- Rack power shelf. Converts AC to a DC bus feeding the compute trays.
- GPU tray. Where the electricity finally becomes arithmetic — and heat.
- Cold plate and coolant loop. Carries that heat out at roughly 2 litres per second.
- Scale-up fabric. NVLink makes 72 GPUs behave as one machine.
- Scale-out fabric. InfiniBand or 800 GbE stitches racks into a cluster.
- Storage and network egress. Weights stream in; tokens stream out.
The two things moving in opposite directions
Power flows in and heat flows out; your prompt flows in and tokens flow out. They share a building and almost nothing else. The electrical path is measured in megawatts and years of lead time. The data path is measured in milliseconds. Confusing the two is the single most common error in writing about this industry.
The whole article in one picture: amber is the power path, green is the product, red is where most of the energy actually goes.
| # | Layer | What it does | Measured in | Who supplies it |
|---|---|---|---|---|
| 1 | Grid connection | Delivers bulk power | MW, years of queue | Utility, regional operator |
| 2 | Substation and switchgear | Steps voltage down, isolates faults | kV, MVA | Electrical equipment makers |
| 3 | UPS and generation | Rides through outages | Seconds, MW | UPS and generator makers |
| 4 | Cooling plant | Moves heat to the outside | kW removed, litres/sec | Thermal equipment makers |
| 5 | Rack and busway | Distributes power mechanically | kW per rack | Rack integrators |
| 6 | Accelerators | Performs the arithmetic | FLOPS, watts | Chip designers and foundries |
| 7 | Memory | Feeds the accelerators | TB/s bandwidth | HBM makers |
| 8 | Network fabric | Makes many chips act as one | Tb/s, latency | Switch and optics vendors |
| 9 | Storage | Streams data and checkpoints | PB, GB/s | Storage vendors |
| 10 | Serving software | Packs requests onto silicon | Tokens/sec | Model and platform providers |
The IEA's equipment breakdown is the best-sourced version of where the power goes inside the fence: servers take roughly 60%, cooling anywhere from 7% in an efficient hyperscale facility to over 30% in a less efficient enterprise one, with storage and networking around 5% each. That 4× spread in cooling share is the real story behind any single efficiency number.
Two terms worth pinning down before we go further, because the rest of the article leans on them: inference is what happens when a trained model answers you, and a token is the unit both the model and your bill are counted in.
🔌 How Much Electricity Does One AI Question Use?
A median text prompt uses roughly 0.24 to 0.34 watt-hours — about what a 10-watt LED bulb burns in 90 to 120 seconds. Three credible figures circulate, none of them agree, and the disagreement is the interesting part.
Why the three published numbers disagree
| Figure | Source | Date | Scope |
|---|---|---|---|
| 0.24 Wh | Google Cloud (Vahdat and Dean), measured | 21 Aug 2025 | Median Gemini Apps text prompt, full serving stack. Also 0.03 gCO2e and 0.26 mL water |
| ~0.3 Wh | Epoch AI (Josh You), estimated | 7 Feb 2025 | Typical GPT-4o query, ~500 output tokens |
| 0.34 Wh | Sam Altman | undated | Scope not stated |
Two of those were produced independently — one measured from inside a serving fleet, one estimated from outside — and they agree to within 25%. That is a strong result for a quantity this contested.
The remaining gap is entirely an accounting-boundary question, and Google published both boundaries, which is what makes the comparison possible. Counting only active accelerator power gives 0.10 Wh and 0.12 mL. Counting the comprehensive figure — host CPUs and memory, idle reserve capacity held for traffic spikes, and data-center overhead — gives 0.24 Wh and 0.26 mL. In other words, the chip doing the thinking is only about 42% of the energy — the rest goes to host CPUs and memory, idle reserve, and facility overhead. A per-query energy figure is close to meaningless without stating which boundary it uses, and most figures in circulation do not.
What actually scales the number
Model size is not the main variable. Context length is. Epoch AI's analysis found that a 10,000-token input pushes a single query toward 2.5 Wh, and a 100,000-token input can approach 40 Wh on its own — roughly 8× and 130× the typical query.
That scaling is the energy signature of the prefill phase, which we will meet properly further down: prefill reads your entire prompt at once, so energy scales with what you send, not with what you get back. Epoch notes this input scaling "can be improved with better algorithms."
The curve is why "how much energy does one query use" has no single answer — the x-axis moves five orders of magnitude in ordinary use.
One figure deserves more attention than it gets, because it points the other way: Google reports that the median Gemini Apps text prompt's energy fell 33× and its total carbon footprint fell 44× in twelve months (May 2024 to May 2025) while response quality rose (MIT Technology Review's analysis of the disclosure is the best independent read of it). Efficiency in this field moves fast enough that any per-query number should carry a date.
The water version of the same accounting fight is even wider. Sam Altman puts a ChatGPT query at about 0.3 millilitres — a fifteenth of a teaspoon — while UC Riverside researchers calculate up to ~519 millilitres, a full water bottle, for a 100-word AI-generated email. Both can be defended, because they measure different pipes: the small number is on-site cooling water for one prompt; the large one adds the indirect water evaporated generating the electricity, in a hot region, on unfavourable assumptions. The 2,000× spread between them is a methodology disagreement, not a measurement error — and it is the single best illustration of why every per-query figure in this article carries a stated boundary.
A caution worth stating plainly: these figures are for text prompts on chat-style models, and the Epoch numbers pre-date reasoning models. Reasoning and agentic workloads emit far more tokens per request, and there is no per-query figure for them that survives sourcing. Several circulate; none trace to a retrievable primary source. Treat any specific watt-hour claim about a reasoning model with suspicion.
If you want the mechanics of why a word and a billed token are not the same unit, that is the tokenizer; why models spend more compute to think longer is test-time compute and reasoning models.
🏗️ Where Does an AI Data Center Get Its Power?
From a high-voltage transmission line, through an on-site substation that steps 230–345 kV down to medium voltage, and onward to the rack. The binding constraint is not generation. It is the wait for that connection, which now exceeds four years across most of the United States.
From 345 kV to a one-volt chip
Voltage steps down five or six times between the transmission line and the silicon, and every step is a room full of equipment with its own lead time. Uninterruptible power supplies and battery backups are not power sources — they are ride-through, holding the load up for the seconds it takes generators to start.
POWER STEPPING: GRID → CHIP Stage                    Voltage        Scale of one unit
─────────────────────    ───────────    ─────────────────────────
Transmission line        230–345 kV     a regional grid
On-site substation        34.5 kV       the whole campus
Unit transformer            415 V       a block of rows
Rack bus (2026 → next)    415 V AC → 800 V DC    one rack
Board rails                 12 V        one GPU tray
Silicon                    ~1 V         the actual thinking
 five conversions, ~200,000:1 — each one loses a little
power as heat before the chip burns the rest on purpose
The last line of that block is the direction of travel: at the Open Compute Project summit in October 2025, NVIDIA laid out 800-volt DC power architectures for rack generations reaching toward 1 MW per rack, pushing one AC-to-DC conversion out of the rack entirely — the same trick the grid itself uses: the higher the voltage, the lower the loss.
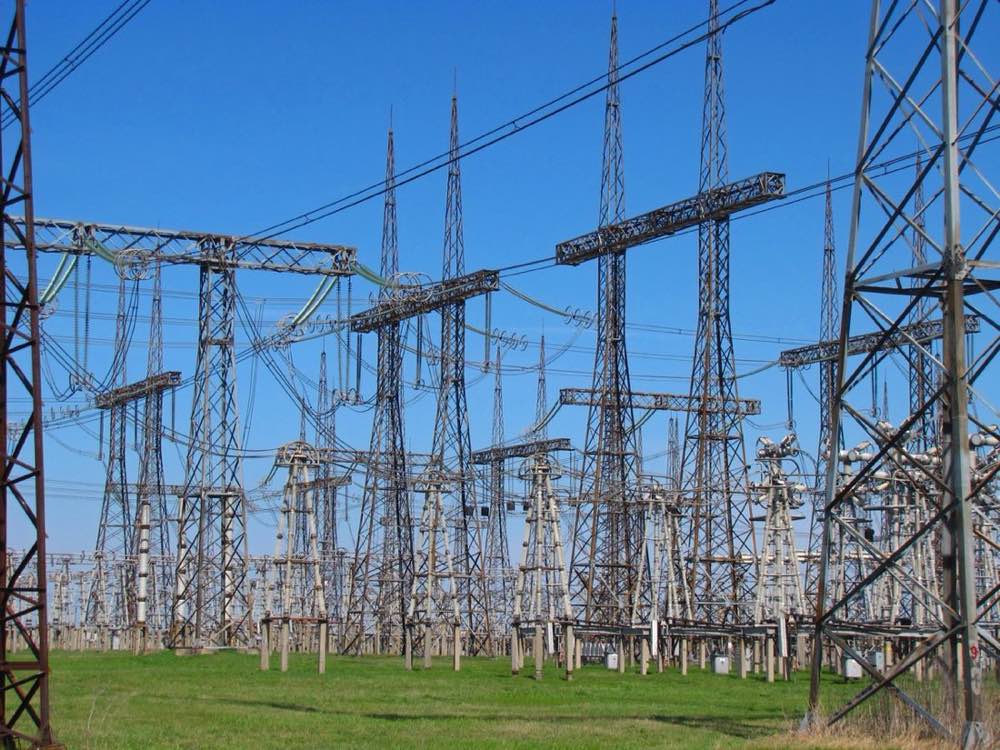
Where the article actually starts: a high-voltage switchyard. Every AI campus needs a smaller version of this on site, and the transformers in it are on 2.5-to-4-year lead times. Photo: Wikimedia Commons / Novoklimov / CC BY 4.0
Why the queue, not the megawatt, is the scarce thing
This is the part that surprises people who assume the constraint is electricity itself. It is paperwork, steel, and time.
| Component | Typical 2026 lead time | Why it binds |
|---|---|---|
| Grid interconnection | 4+ years | Sequential studies; queue reform is ongoing |
| Large power transformer | 2.5–4 years | Global manufacturing capacity, long since sold out |
| Gas turbine | Multi-year | Slot reservations booked years forward |
| Medium-voltage switchgear | 12+ months | Same supply chain as the grid build-out |
| Advanced accelerators | Months | Fastest-moving item in the whole chain |
| Shell construction | 12–24 months | Rarely the critical path |
The asymmetry in that table is the whole story: you can have your chips in months and the grey box that powers them in 2029.
The 2026 edition of Lawrence Berkeley National Laboratory's Queued Up analysis puts current numbers on the jam: more than 2,060 GW of generation and storage capacity sat in US interconnection queues at the end of 2025 — well over the country's entire installed generating fleet — with a typical wait of around five years, stretching to roughly seven years in PJM territory and dropping to three to four in ERCOT, whose connect-and-manage process is the main reason so much AI construction is happening in Texas.
The same analysis adds the discount almost nobody applies: only about 13% of capacity entering interconnection queues between 2000 and 2020 had reached commercial operation by the end of 2025, and roughly 75% withdrew. Every large queue figure you read is a pile of applications, many of them cheap to file and frequently duplicative — not incoming capacity.
The four ways to power a site, ranked by wait
| Strategy | Time to power | The catch |
|---|---|---|
| Grid interconnection | ~4–7 years (PJM ~7, ERCOT 3–4) | The queue itself; transformer lead times ride on top |
| On-site gas turbines | 12–18 months | Slot reservations, emissions permits, fuel contracts |
| Co-location with existing generation | Months to ~2 years | Live regulatory question — who pays for the grid? |
| Small modular reactors | ~5–10 years | Zero commercial units serving a data center yet |
That table explains most of the industry's odd-looking behaviour in 2026: gas turbines humming beside brand-new campuses (Colossus runs on them), hyperscalers signing nuclear deals that deliver in the 2030s, and land near existing power plants trading at data-center prices.
⚠️ A related figure worth handling carefully, because it is widely miscited: the often-quoted "410 GW waiting, 87% of it data centers" is ERCOT's Texas large-load queue, presented to the Texas House Committee on State Affairs in April 2026 — not a national generation queue. The two are different objects and are routinely merged.
On-site generation and the grid-cost conversation
Because the queue is long, operators increasingly generate on site or co-locate next to existing generation. That has become a live regulatory question rather than a settled workaround, with federal regulators actively examining how co-located load should pay for transmission.
There is also a ratepayer dimension, and the honest version is mechanical rather than moral: in the PJM market — the grid covering 13 states — the most recent capacity auction cleared at the regulator-approved cap of $325 per MW-day, with the market monitor attributing roughly $6.3 billion of $16.4 billion in capacity cost to data centers. Capacity markets exist to pay for the ability to serve peak load, and large new loads raise that bill for everyone on the system. That is a real cost, it is being actively regulated, and it is one of the reasons siting has become the hardest part of the business.
For what running physical racks actually felt like before any of this, our own path from web hosting to AI infrastructure covers that ground.
Six voltage conversions between the transmission line and the chip. Each box is a room, a lead time, and a line on the capital plan.
💧 Why Do AI Data Centers Need Liquid Cooling?
Because air physically runs out of capacity. Air cooling becomes impractical somewhere around 30 kW per rack, and a flagship AI rack draws 120 kW. There is no fan arrangement that closes that gap.
Where air stops working
ASHRAE's technical committee puts numbers on it: a 40–50 kW rack can require up to 5,000 cubic feet per minute of airflow, while a best-in-class raised-floor tile delivers about 1,900. You would need roughly three tiles of perfect airflow per rack, and the fan power to move that much air starts consuming a meaningful share of the rack's own budget.
Water wins because of volumetric heat capacity — and it is worth stating the basis, because three different ratios circulate for the same pair of fluids and they are not interchangeable:
| Property | Water vs air | What it governs |
|---|---|---|
| Volumetric heat capacity | ~3,500× | How much heat a given volume of coolant can carry — the number that matters for a loop |
| Specific heat per unit mass | ~4.2× | Heat per kilogram, not per litre |
| Thermal conductivity | ~23× | How fast heat crosses a boundary |
Concretely: removing 120 kW at a 10 °C rise takes roughly 21,000 CFM of air or about 46 gallons per minute of water. That is the entire argument.
Direct-to-chip, rear-door, and immersion
| Method | Max rack density | How heat leaves the chip | On-site water |
|---|---|---|---|
| Raised-floor air | ~15 kW | Fans, room air | Evaporative tower |
| In-row / containment | ~30 kW | Close-coupled air | Evaporative tower |
| Rear-door heat exchanger | ~40 kW | Water-cooled radiator on the rack | Facility loop |
| Direct-to-chip (D2C) | 75–175 kW | Cold plate on the die, pumped loop | Often closed loop |
| Single-phase immersion | 150–225 kW | Whole server in dielectric fluid | Closed |
NVIDIA's flagship rack-scale systems do not offer liquid cooling as an option. They require it.
The market is repricing accordingly. Data-center liquid cooling was a $5.52 billion market in 2025 and is projected to reach $15.75 billion by 2030 — roughly 23% a year — yet only about 22% of facilities had adopted it by 2025, with direct-to-chip taking about 47% of the liquid-cooled share. The efficiency argument does the selling: direct liquid cooling runs at a PUE of roughly 1.03–1.1, against 1.3–1.6 for legacy air-cooled facilities. On a 100 MW site, the difference between those two numbers is a mid-sized town's worth of electricity spent on nothing but moving heat.
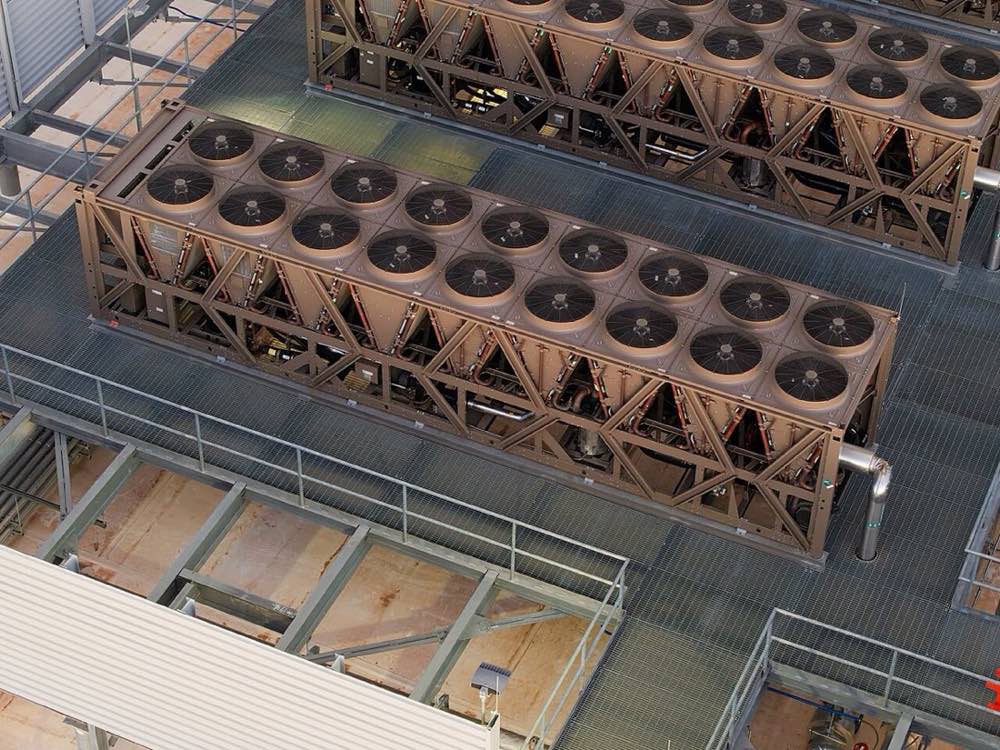
The other end of the coolant loop: banks of fan-driven heat rejection units on a data-center roof in Mesa, Arizona. Every watt the racks below draw eventually crosses this roof. Photo: Wikimedia Commons / Rsparks3 / CC0
What a CDU actually does
A coolant distribution unit is the rack's heart. It pumps coolant through every cold plate and hands the collected heat to the building's water loop, keeping the two loops separate so a leak in one does not contaminate the other.
Coolant enters a flagship rack at about 25 °C at roughly 2 litres per second, and leaves about 20 °C warmer. Every watt the rack drew is in that temperature rise.
Hold on to that sentence. We will come back to it.
Follow the temperature, not the arrows. The rise across the cold plate is the rack's entire power draw, restated in degrees.
🧊 What Does an AI Data Center Look Like Inside?
Rows of identical cabinets on a concrete slab, overhead busway and cable tray where a ceiling would be, a coolant manifold running down every row — and inside each flagship cabinet, 72 GPUs wired to behave as a single machine, drawing about 120 kW nominal (130–132 kW as deployed) and weighing over a ton and a half. That is roughly the electrical demand of 100 average US homes, in one cabinet you could stand next to.
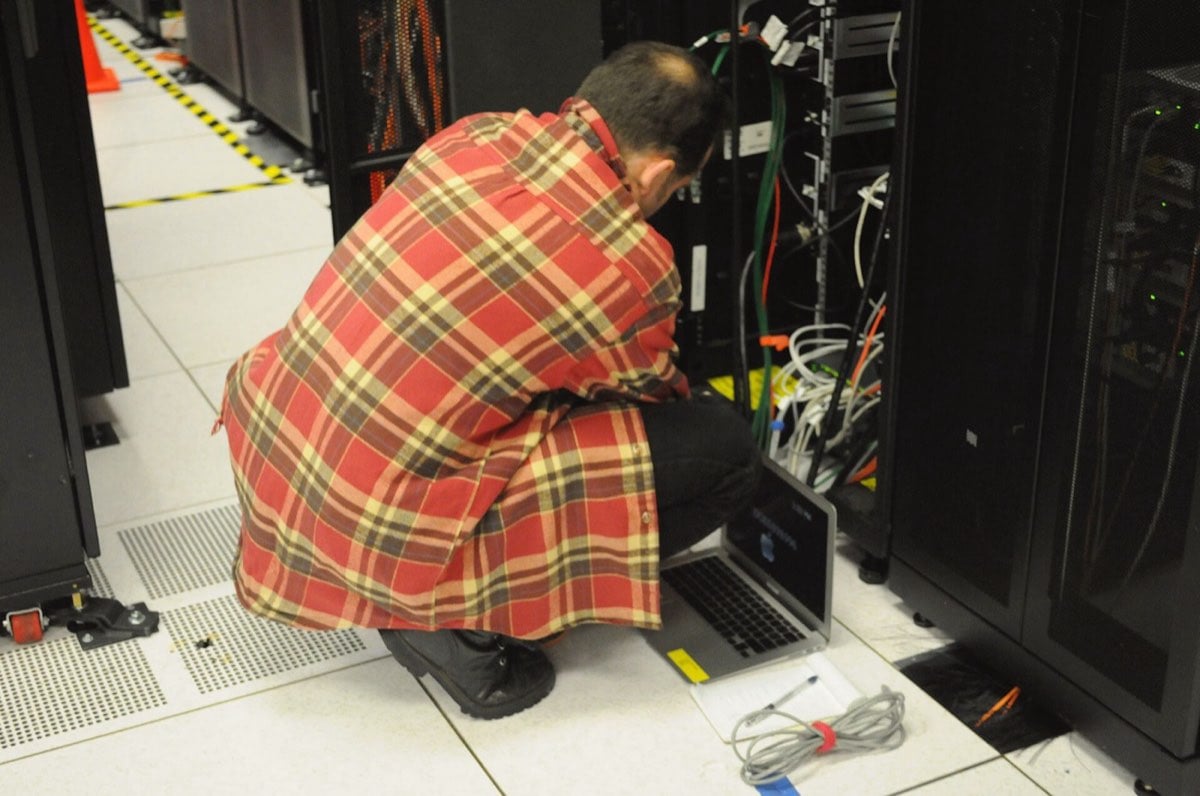
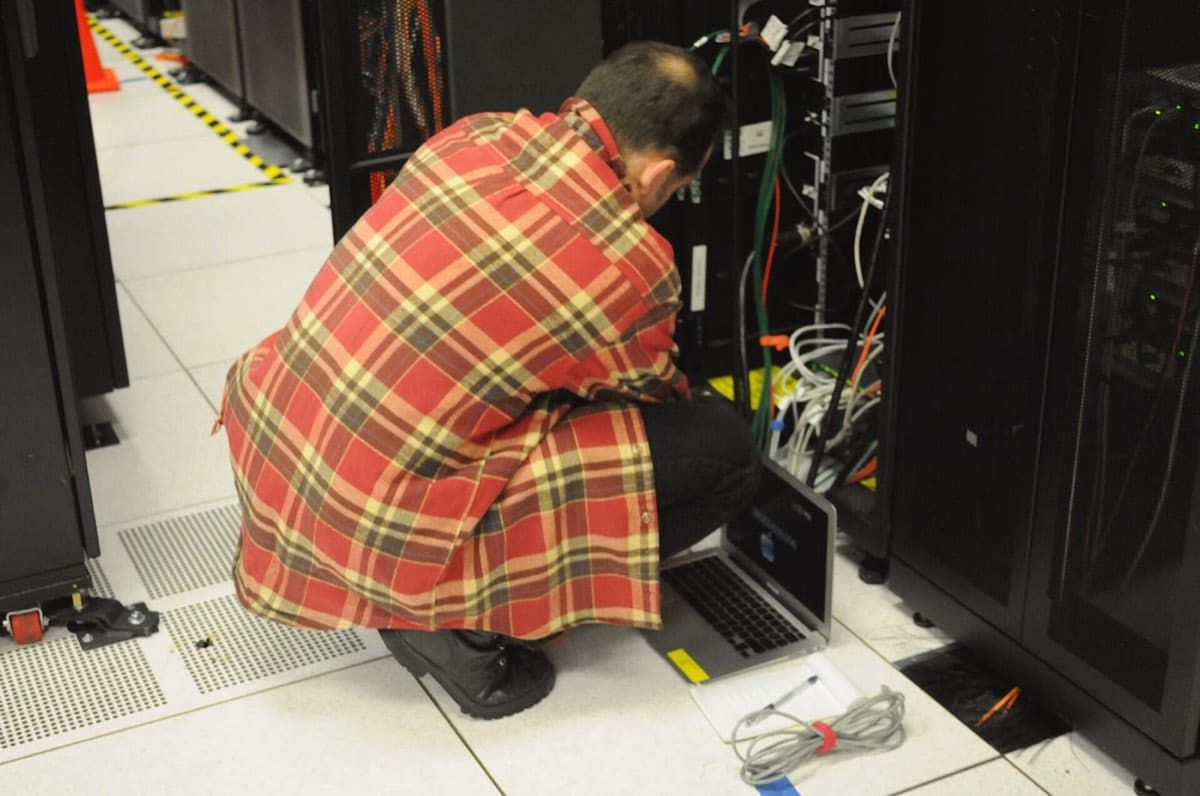
What the inside actually looks like: a technician at a rack in the NERSC scientific computing center. The glamour is entirely in the arithmetic — the room itself is cabling, sheet metal, and airflow. Photo: Wikimedia Commons / Derrick Coetzee / CC0
Seventy-two GPUs, one machine
The rack is built from compute trays and switch trays. The switch trays are not networking in the ordinary sense — they are what lets 72 separate processors share one address space and behave, from software's point of view, like a single very large computer.
Why the rack got plumbing
The mechanical change is as significant as the electrical one. A modern AI rack has a busbar carrying hundreds of amps, a coolant manifold with quick-disconnect fittings on every tray, and a power shelf converting AC to a DC bus. Racks used to be cabled. Now they are plumbed.
The financial change is starker still: a fully populated AI rack runs to roughly $3.9 million, against about $500,000 for a traditional high-density rack — an 8× jump in the value of a single cabinet, which is why "dominant cost: accelerators" appeared in the very first table of this article.
How the chips got here: the TDP ladder
The rack's power draw is just the sum of its chips, and the chips have been climbing a steep, well-documented ladder (IEEE Spectrum):
| GPU generation | Year | TDP per GPU |
|---|---|---|
| V100 (Volta) | 2017 | 300 W |
| A100 (Ampere) | 2020 | 400 W |
| H100 (Hopper) | 2022 | 700 W |
| B200 (Blackwell) | 2024 | ~1,200 W |
| Next generations, disclosed | 2026+ | 2,000 W+ |
A quadrupling per chip in under a decade, multiplied by more chips per rack — that compounding, not any single product, is what pushed the industry through the 30 kW air-cooling ceiling and into the plumbing business.
| Rack type | kW per rack | Cooling required | Roughly equivalent to |
|---|---|---|---|
| Legacy enterprise | ~5 kW | Air | A few electric kettles |
| General-purpose | ~10 kW | Air | A small house |
| Deployed fleet average | ~11 kW | Air | A small house |
| Dense CPU | ~20 kW | Air, with difficulty | Two houses |
| AI baseline | ~60 kW | Liquid | A dozen houses |
| Flagship rack-scale | ~120 kW | Liquid, mandatory | ~100 houses |
| Next generation, disclosed | ~600 kW | Liquid | A small neighbourhood |
⚠️ That last row is the most miscited number in the category. The 600 kW figure belongs to a rack architecture scheduled for 2027, not to the systems shipping now. Pairing it with a current product — which a great deal of coverage does — overstates the near-term density jump by roughly a factor of three. Beyond it sits the 1 MW-per-rack, 800-volt DC direction NVIDIA sketched at the October 2025 OCP summit — a roadmap, not a product, and worth the same caution.
Who designs the silicon, and how CUDA turned a graphics chip into the substrate of an industry, is a story told properly in the history of NVIDIA and Jensen Huang. And the constraint underneath the constraint starts at the foundry — how TSMC invented the pure-play model explains why so much of this chain converges on so few factories.
Compute, switching, power, and plumbing — four systems sharing one frame.
🕸️ How Do Thousands of GPUs Behave Like One Computer?
Through two different networks with two different jobs. A scale-up fabric makes the GPUs inside one rack act as a single address space. A scale-out fabric stitches racks into a cluster. They have different bandwidths, different topologies, and different failure modes.
| Fabric | Scope | What it is for | What breaks if it is slow |
|---|---|---|---|
| NVLink / NVSwitch | Inside the rack | One address space across 72 GPUs | The rack stops behaving as one machine |
| InfiniBand | Rack to rack | Low-latency collective operations | Training steps stall on synchronisation |
| 800 GbE / RoCE | Rack to rack | Same job, open standard | Same |
| PCIe | Host to accelerator | Getting data onto the GPU | Feeding stalls |
| Front-end network | Cluster to internet | Your prompt, and the answer | Latency you can feel |
The optics nobody budgets for
Copper carries these speeds only a few metres, so anything crossing the room becomes light. Optical transceivers convert electrical signals to photons and back, and you need one at each end of every link. At cluster scale that is hundreds of thousands of modules, each consuming power and each a potential failure.
This is the under-covered part of large-scale training: the most common hardware failure in a big run is a link, not a GPU. A cluster's reliability is a network property long before it is a silicon property.
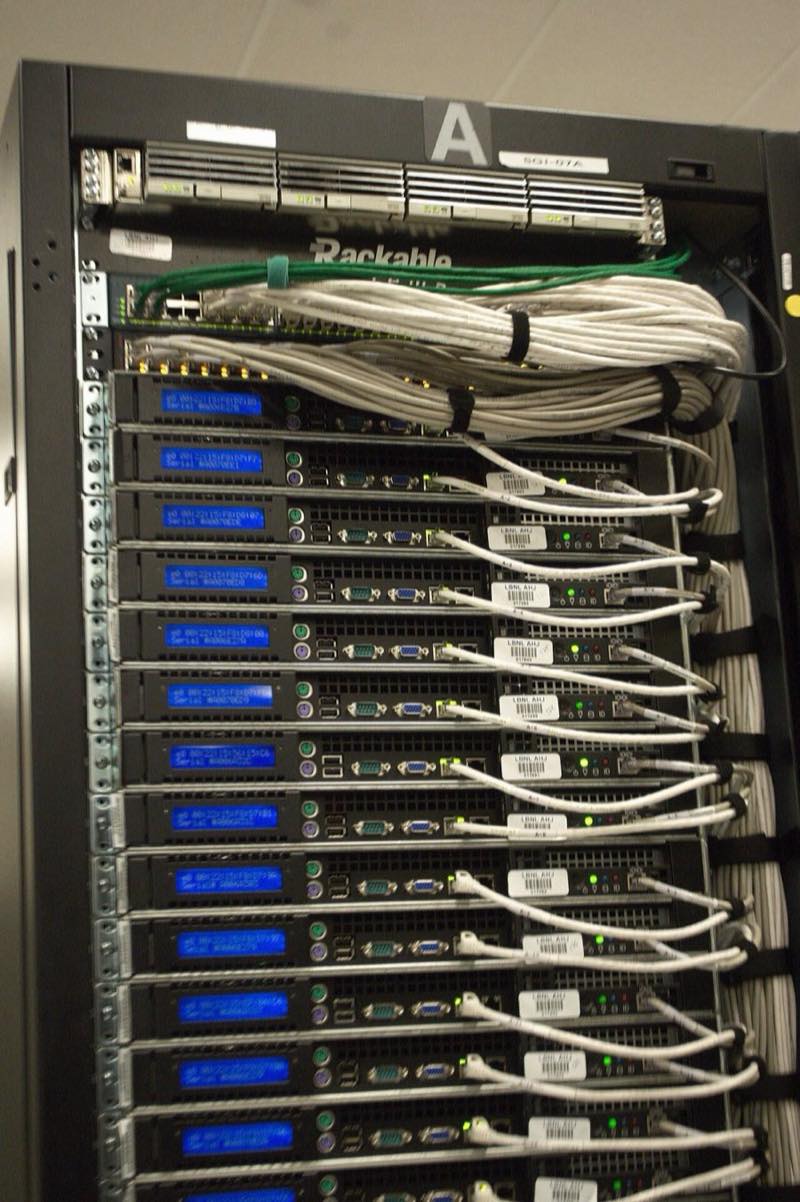
The back of the rack is where clusters actually live and die: every one of those cables is a link, and links — not GPUs — are the most common failure in a large training run. Photo: Wikimedia Commons / Derrick Coetzee / CC0
For the general principles underneath all of this — bandwidth, latency, and how distributed systems are actually laid out — system design explained covers the fundamentals, and AI system design tools includes a capacity-estimation cheat sheet that is the practical companion to the power math above.
Scale-up inside the rack, scale-out between racks. Two fabrics, two jobs, two different things that break.
🧠 Why Is Memory, Not Compute, the Real Bottleneck?
Because generating a token requires reading the model's parameters out of memory, so text generation is limited by memory bandwidth rather than by arithmetic. This is the single least intuitive fact about AI infrastructure, and it explains why high-bandwidth memory rather than raw FLOPS sets the ceiling on how many users one GPU can serve.
Why generation is sequential
A model produces one token, appends it to everything written so far, and runs the whole network again for the next one. There is no way to produce token five without having produced token four. That sequential dependency is why next-token prediction is both the source of the technology's power and the source of its cost.
Inference has two phases with opposite hardware profiles, and conflating them is the most common technical error in this category:
- Prefill reads your entire prompt in parallel. It saturates the arithmetic units and is compute-bound. This is the pause before the first word appears.
- Decode produces one token per pass. The arithmetic is trivial; the bottleneck is pulling weights and cached state out of memory. It is memory-bandwidth-bound, and it sets both generation speed and cost.
The KV cache is the real tenant of GPU memory
During prefill the model builds a working memory of the conversation — the KV cache — and keeps it beside the chip. It grows with context length, and on long conversations it can occupy more GPU memory than the model weights. This is the concrete reason a longer context window costs more: you are renting fast memory for the duration.
| Tier | Bandwidth class | Latency | What lives here |
|---|---|---|---|
| Registers / SRAM | Fastest | ~1 ns | Active working values |
| HBM | ~TB/s | ~100 ns | Model weights, KV cache |
| Host DRAM | ~100 GB/s | ~100 ns+ | Staging, overflow |
| Local NVMe | ~GB/s | ~100 µs | Checkpoints, hot datasets |
| Networked object store | Slowest | ~ms | Training corpora, archives |
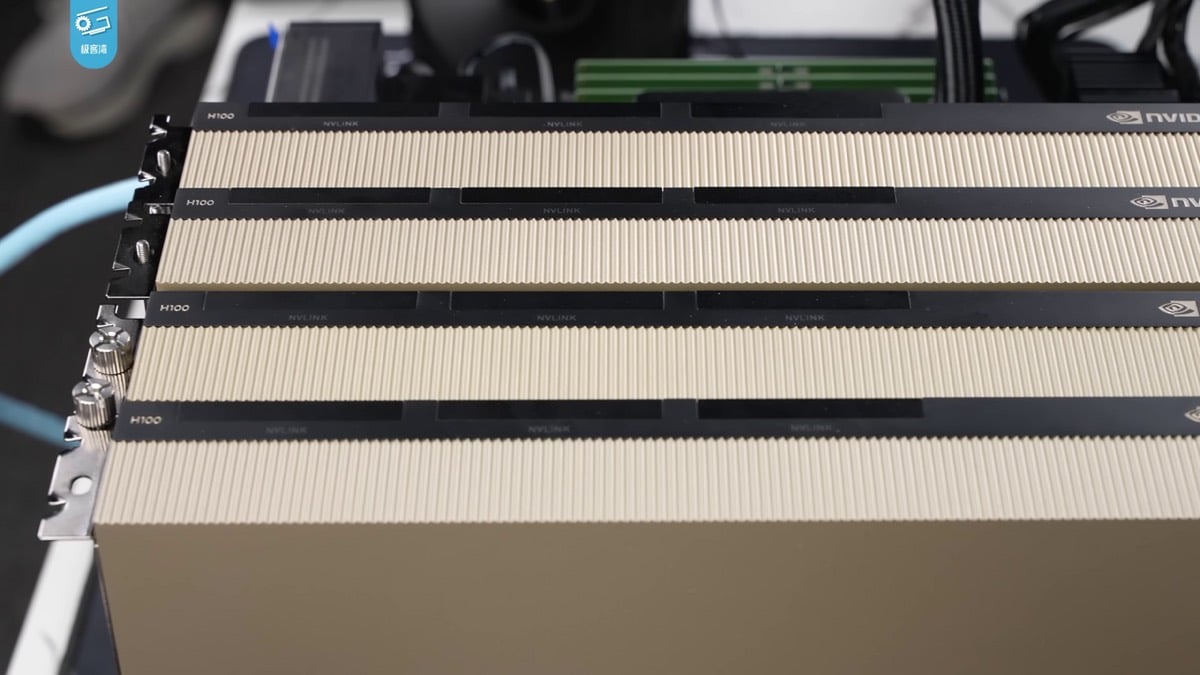
The object all this plumbing serves: NVIDIA H100 accelerators, NVLink connectors exposed along the top edge. The high-bandwidth memory stacked millimetres from each die — not the arithmetic units — is what sets how many users each card can serve. Photo: Wikimedia Commons / 极客湾Geekerwan / CC BY 3.0
What the storage layer is for
Two jobs. During training it streams petabytes sequentially. And it checkpoints: a large run writes terabytes every few minutes, because a single failed node means replaying from the last saved state. Checkpoint frequency is a bet on how often something will break.
How the size of a model relates to the compute it needs is the domain of scaling laws, and prompt caching is the mechanism that lets repeated context skip prefill entirely.
🔁 What Actually Happens to Your Prompt Inside the Building?
Your request crosses roughly eight software stops before it touches silicon — gateway, authentication and metering, router, scheduler, batcher, KV cache, kernels, detokenizer — and the scheduler is the one that decides whether the facility is profitable.
Why batching is the business model
A GPU running one user's request wastes most of its capacity, because decode is memory-bound and the arithmetic units sit idle waiting for weights. The fix is continuous batching: the scheduler packs many users' requests into the same pass, so one read of the weights serves dozens of people at once.
That single technique is the difference between your question costing cents and costing dollars. It is also why serving cost per user falls as a service gets busier — the opposite of most infrastructure.
The one lever on your side of the wire
Most of this is invisible to you, but one part is not: prompt caching. If you send the same long preamble repeatedly, providers can skip re-running prefill over it. Since prefill scales with input length, that is the lever with the largest effect on both latency and cost for document-heavy workloads.
Note the loop. Everything above it happens once; everything inside it happens per token.
How a platform decides which model should answer is model routing. If you want the buyer-side playbook rather than the infrastructure view, five techniques that cut an LLM bill covers that ground properly.
🎓 What Is the Difference Between Training and Inference?
Training is one enormous synchronous job. Inference is millions of small latency-sensitive ones. Training builds the model and can be sited anywhere with enough power. Inference runs it and wants to be near users. That difference increasingly means two different buildings in two different places.
| Dimension | Training | Inference |
|---|---|---|
| Job shape | One job, thousands of GPUs, weeks | Millions of jobs, milliseconds each |
| Latency tolerance | High — nobody is waiting | Low — someone is watching a cursor |
| Siting constraint | Power availability | Proximity to users |
| Utilization | Near 100% by design | Spiky, follows human daily rhythm |
| Failure cost | Replay from last checkpoint | Retry one request |
| Hardware constraint | Interconnect bandwidth | Memory bandwidth |
| What 10× users does | Almost nothing | Multiplies the bill |
Why inference stopped being the cheap half
Training happens once per model. Inference happens billions of times a day, and the shift to agentic and reasoning workloads changed the arithmetic: a single user request that once produced one model call now produces a loop of them. The cost per token has fallen dramatically while the number of tokens per completed task has risen — and those two curves do not cancel.
A model's lifecycle. Everything before Serving happens once; the self-loop is every request ever made.
The deeper treatment of what happens when models spend more compute at answer time lives in world models and inference-time scaling and model training.
🔥 Where Does All That Electricity Actually End Up?
Essentially all of it becomes heat. Better than 99% of every joule that crosses the fence line leaves the building as low-grade warmth within seconds. An AI data center converts electricity into warm water and emits tokens as a side effect.
This is where the industry's favourite metaphor breaks, and it is worth breaking carefully, because the metaphor is genuinely useful right up until it isn't.
Is an AI data center really an "AI factory"?
Not physically, no. A steel mill's iron ore becomes the beam — mass in, mass out, the raw material is the product. An AI data center has no such conservation. The tokens are not made of the electricity. They are a pattern imposed on the path the heat takes to the atmosphere. The product weighs nothing, occupies no volume, and consumes essentially none of the input.
The scale of that gap is not rhetorical. Landauer's limit puts the theoretical minimum energy to erase one bit at about 3 × 10⁻²¹ joules — roughly nine orders of magnitude below what the hardware actually burns to produce it. Even at the physical floor, the information is thermodynamically almost free. The electricity is not paying for the tokens. It is paying for the machinery that arranges them.
Remember the coolant: 25 °C in, 45 °C out, about 2 litres per second. That temperature rise is the rack's entire power draw, restated in degrees. Nothing else left.
Four things that follow from this
1. Cooling is not support infrastructure. It is the output conveyor. Warm water is the only physical thing the building ships. Every other section of this article is upstream of that fact.
2. "Efficiency" cannot mean "waste less," because 100% is the waste stream. There is nothing to trim. Efficiency can only mean more tokens per joule of heat. This is precisely why operators increasingly optimise tokens per watt rather than PUE. Power usage effectiveness measures the ratio of total facility power to IT power — it asymptotes at 1.0 and then has nowhere to go. Tokens per watt has no ceiling.
3. Liquid cooling is an economic technology before it is an environmental one. Moving to water does not remove a single joule of heat. It lets you put an order of magnitude more compute inside the same footprint and power envelope. The environmental benefit is real but second-order — and we will get to it in the next section, because it is the part almost everyone misses.
4. Heat is the one output you could sell twice, and mostly can't. It leaves at 45–70 °C: too cold for industrial processes, barely warm enough for district heating, and useful only if someone nearby wants it. Waste-heat recovery is a siting decision made years before the concrete pours, not a retrofit.
| Goes in, per MWh | Comes out, per MWh |
|---|---|
| 1 MWh of electricity | ~1 MWh of heat at 45–70 °C |
| ~0 kg of raw material | ~0 kg of product |
| Water for cooling | The same water, warmer |
| Nothing | A few hundred million tokens, massless |
What survives of the metaphor
The economics. A token is fungible, priced per unit, produced at marginal cost, and sold by the million — exactly like a factory's output. The business is a factory. Only the physics isn't. Keep the metaphor for the balance sheet and drop it for the thermodynamics.
Look at the width of the dotted edge. That is the product, and this is the honest energy diagram of an AI data center.
📈 How Much Electricity Do AI Data Centers Use in Total?
Global data centres used 415 TWh in 2024 — about 1.5% of world electricity — and the IEA projects that more than doubling to around 945 TWh by 2030. The United States accounts for roughly 45% of the global total, China 25%, and Europe 15%.
The United States specifically, with a correction
The most-quoted US figure in circulation is out of date, and it was superseded by the laboratory that issued it. Lawrence Berkeley National Laboratory's 2025 Update, published 18 June 2026, puts 2024 US data-center electricity at 192 TWh, or 4.7% of total US consumption — a downward revision driven by reduced reported accelerator shipments and revised assumptions about inference server power.
Its reference case projects 464 TWh by 2028 and 649 TWh by 2030, equal to 11.8% of forecast US electricity, with a compounded-uncertainty range of 521–843 TWh. Data centers account for roughly a third of total US electricity load growth to 2030.
Separately, the EIA's Annual Energy Outlook 2026 estimates servers alone accounted for about 7% of US commercial-sector electricity in 2025.
The AI-specific slice is growing much faster than the total. Gartner projects AI-server electricity at 95 TWh in 2025, 175 TWh in 2026 — an 84% jump in a single year — and 258 TWh in 2027, the year AI servers are projected to pass conventional servers as the larger consumer. Read against the IEA's 415 TWh total for all data centres in 2024, that curve says the growth story and the AI story are now the same story.
| Metric | Value | Year | Source |
|---|---|---|---|
| Global data-centre electricity | 415 TWh (~1.5% of world total) | 2024 | IEA |
| Global projection | ~945 TWh | 2030 | IEA |
| Regional split | US 45% / China 25% / Europe 15% | 2024 | IEA |
| US data-centre electricity | 192 TWh (4.7%) | 2024 | LBNL (Jun 2026) |
| US projection, reference case | 649 TWh (11.8%) | 2030 | LBNL (Jun 2026) |
| US projection, uncertainty band | 521–843 TWh (9.5–15.3%) | 2030 | LBNL (Jun 2026) |
| Servers as share of US commercial electricity | ~7% | 2025 | EIA AEO2026 |
The discount nobody applies to the forecasts
Every demand projection in this category is gross of the interconnection conversion rate. Announced capacity is not built capacity, and historically only about 13% of queued capacity has reached operation. That does not make the forecasts wrong — the reference cases are built by careful people — but it does mean announcement-based numbers, which is what most media coverage aggregates, systematically overstate what will physically exist.
The IEA base case. The uncertainty on the right-hand half of this curve is larger than the left-hand half's total value.
🚰 How Much Water Does an AI Data Center Use?
Most of it is not where people look. The majority of a data center's water footprint is indirect — water evaporated at the power plants generating its electricity — rather than water used on site for cooling. On site, a median text prompt consumes about 0.26 millilitres, roughly five drops.
Direct water vs indirect water
Lawrence Berkeley National Laboratory research estimates US data centers directly consumed about 66 billion litres in 2023 (up from about 21 billion in 2014), while the water consumed generating the electricity they used was several times larger again. That ratio is the single most important fact in the water conversation and the one most often omitted.
The trajectory matters as much as the level: the Environmental and Energy Study Institute puts US data-center water use at about 17 billion gallons in 2024, projected to reach as much as 80 billion gallons a year by 2028 as AI capacity comes online. (17 billion gallons is ~64 billion litres — the same quantity as the LBNL figure in different units, which is reassuring: two independent trackers agree on the baseline.)
Why closed loops change the picture
Here is the connection almost nobody makes, and it follows directly from the previous section. Evaporative cooling towers consume water by design — evaporation is how they reject heat. Closed direct-to-chip liquid loops evaporate nothing at the rack — but they still hand their heat to the facility loop, and whether water is consumed depends on how that loop rejects heat: an evaporative tower still evaporates, a dry cooler does not. So the industry's move to liquid cooling, which happened for density and economics, becomes the largest available on-site water mitigation when it is paired with non-evaporative heat rejection. Microsoft has described data-center designs that pair direct-to-chip cooling with non-evaporative heat rejection and consume zero water for cooling, avoiding an estimated 125,000 cubic metres annually per facility.
The cooling section of this article is the answer to the water section, and the two are usually written by different people who never join them.
What actually determines whether it matters
Location, not volume. Google reports that 87% of its 2025 freshwater withdrawal came from sources at low or medium risk of depletion or scarcity. A litre in a water-rich basin and a litre in a stressed aquifer are not the same litre, and aggregate national figures obscure exactly the variable that decides whether a given facility is a problem.
One definitional trap worth knowing: withdrawal and consumption differ by roughly an order of magnitude, and conflating them is the most common error in circulation. Withdrawal is water taken and largely returned; consumption is water evaporated and gone.
| Path | Share | Mechanism | Lever that reduces it |
|---|---|---|---|
| Electricity generation | Majority | Thermoelectric cooling at power plants | Grid decarbonisation, efficiency |
| Evaporative cooling towers | Most on-site use | Evaporation rejects heat | Closed-loop D2C, dry coolers |
| Adiabatic assist | Seasonal | Evaporative boost on hot days | Higher-temperature operation |
| Closed-loop direct-to-chip | ~0 on site | Sealed loop, no evaporation | Already the mitigation |
The branch on the right is the larger one, and it is the branch that never appears in per-query water figures.
🧱 What Does It Cost to Build an AI Data Center?
Roughly $10–12 million per megawatt for a conventional facility and $20–30 million per megawatt for an AI-optimized one — and the accelerators, not the building, dominate the total.
The three questions hiding in one
"What does AI cost to run" is three different questions that get answered interchangeably. Here they are, separately: what it costs to build the facility, what it costs to train a model, and what it costs to answer one question. This section and the next two take them in order.
| Line item | Rough share of project cost | Note |
|---|---|---|
| Accelerators and servers | Largest single line | Also the shortest-lived asset |
| Electrical (substation, transformers, switchgear, UPS) | Major | Longest lead times |
| Mechanical and cooling | Major | Grows with density |
| Shell and land | Modest | Rarely the critical path |
| Networking and optics | Modest but rising | Scales with cluster size |
The IEA reported technology-sector capital spending above $400 billion in 2025, with plans to increase substantially in 2026. One caution when reading capex coverage: headline "AI capex" figures are frequently total corporate capital expenditure for the companies involved, which includes warehouses, offices, and everything else those businesses build. It is the wrong denominator, and it circulates widely.
🎯 What Does It Cost to Train a Model?
It depends entirely on which accounting you use, and the spread is large enough to change the story. GPT-4's final training run was about $40 million on Epoch AI's amortized-hardware basis and about $78 million on Stanford's cloud-rental basis — for the same run.
| Model | Amortized hardware (Epoch AI) | Cloud-rental equivalent (Stanford AI Index) | Ratio |
|---|---|---|---|
| GPT-4 | ~$40M | ~$78M | ~2× |
| Gemini Ultra | ~$30M | ~$191M | ~6× |
Neither number is wrong. They answer different questions: what it cost the owner of the hardware, versus what it would have cost to rent the same compute. Any training-cost figure without a stated basis is uninterpretable.
The half of the cost that is people
The under-published finding in Epoch's decomposition: research and engineering staff account for 29–49% of amortized cost. Training a frontier model is closer to a salaried engineering program than a compute purchase. The GPU bill gets the headlines; the payroll is the same order of magnitude.
The relationship between model size, data, and compute is the subject of scaling laws, and the moment GPUs became the substrate of machine learning at all is covered in the ImageNet moment.
💰 What Does It Cost to Answer One Question?
Production inference averaged roughly $0.77 per million tokens across providers in April 2026, with budget tiers from about $0.075 per million input tokens. Because output tokens are priced 4–6× input tokens, the shape of a request matters more than its raw length.
From megawatt to token
This is the conversion nobody publishes end to end. Facility economics are quoted in dollars per megawatt; model economics are quoted in dollars per million tokens; and the two literatures almost never touch. The ladder between them is short:
| Step | Unit | What sets it |
|---|---|---|
| Build cost | $/MW | Density, cooling choice, electrical design |
| Electricity | $/MWh | Region, contract, capacity charges |
| Facility yield | 1/PUE | How much purchased power reaches a chip |
| Rack density | kW/rack | Cooling technology |
| Useful life | years | Depreciation schedule — the swing factor |
| Throughput | tokens/sec/GPU | Memory bandwidth, batch size |
| Energy intensity | Wh/1k tokens | Model, context length, serving stack |
| Price | $/1M tokens | All of the above, plus margin |
The money path, in eight conversions. Every step is publicly documented; the chain rarely is.
Notice where the previous section's argument lands here. Since essentially 100% of the input energy becomes heat, the only efficiency lever with real headroom is tokens per joule — not reducing waste, because there is no waste stream to reduce, but getting more output from the same thermal budget. That is why serving-layer work (batching, caching, quantisation) produces larger cost movements than facility efficiency does.
How fast the price is actually falling, and why nobody agrees
Published estimates of the decline in cost-per-fixed-quality range from roughly 50× to 200× per year, depending on the benchmark, the quality threshold, and the accounting basis. That is a wide enough band that quoting a single figure is more misleading than quoting the range. What is not contested is the direction, or the countervailing force: cost per token is falling fast while tokens per completed task are rising, because reasoning and agentic loops spend far more of them.
Depreciation is the other swing factor, and it is worth naming because it moves reported economics more than most operational choices: every year of useful life added or removed shifts billions in reported profit, and the industry has not converged on whether an accelerator lasts four, five, or six years.
For the practical version of all this — what you can actually do about a bill — see reducing LLM costs, AI agent cost optimization, and AI app builder pricing. If you are weighing running models yourself, open-source LLMs has the self-hosting comparison.
🏭 Who Makes What in an AI Data Center?
The stack has five supplier layers — foundry, accelerator, system integration, facility equipment, and cloud operator — and in 2026 the binding constraint moved down the stack, from chips to transformers, turbines, and grid approvals.
| Layer | What it does | 2026 bottleneck |
|---|---|---|
| Foundry | Fabricates the silicon | Advanced packaging capacity |
| Accelerator design | Designs GPUs and custom chips | Design cycles, memory supply |
| Memory | Supplies high-bandwidth memory | Allocated a year or more forward |
| System and rack integration | Builds and plumbs the racks | Liquid-cooling manufacturing |
| Power and cooling equipment | Substations, switchgear, CDUs | Transformers, turbines |
| Network and optics | Switches and transceivers | Optics volume |
| Cloud and colocation | Operates the facility | Grid interconnection |
The interesting movement is that last column. In 2023 the answer to "what is holding up AI" was accelerators. In 2026 it is increasingly electrical equipment and permission to connect — items with multi-year lead times and no possibility of a rush order.
The virtualization layer that made rented compute sellable in the first place has its own history in the history of virtualization.
🧑💻 What Does Any of This Mean If You Just Want to Build Something?
It means you are renting a share of that building, by the token, and someone else is carrying the four-year interconnection queue.
That is worth stating plainly rather than dressing up. Taskade does not own data centers. Taskade sits at the application layer — it buys tokens, like almost everyone building with AI today. In the machine this article describes, the application layer is where the electricity finally turns into something a person asked for.
What the abstraction actually buys you
Everything in this post exists so that a sentence you typed can become a working thing. When you describe an app and Taskade Genesis builds it, that request walked every stop above — the substation, the coolant loop, the 120 kW rack, the KV cache — and came back as a running application. You never sized a GPU fleet, never queued for an interconnection, never picked a model. Taskade EVE routes across 15+ frontier models from OpenAI, Anthropic, Google, and open-weight providers, so model routing is a decision the platform absorbs rather than one you make per request.
Where the compute shows up in your own work
Three places, and knowing which is which is most of practical cost control:
- Long context is prefill. Attaching a large document is the expensive part of a request, not the answer you get back. This is the 2.5 Wh and 40 Wh scaling from earlier, in product form.
- Agentic loops multiply requests. One instruction that triggers a chain of automations is many inference calls, not one. Always-on workloads are what actually fill a data center.
- Repeated preambles are cacheable. The same context sent repeatedly can skip prefill entirely.
If you want to see what the output side of all this machinery actually looks like, the community gallery is full of apps other people built from a prompt, and integrations is where that compute touches the rest of your systems.
The broader argument that a workspace is itself becoming a kind of computer is made in your workspace is a computer.
🚀 Quo Vadis, AI Data Centers?
Three open questions, and the honest answer to all three is that nobody knows yet.
1. Which binds first — the fab or the substation? Chips were the 2023 constraint. Transformers and interconnection queues are the 2026 one. Where the next hundred billion goes depends on which one clears first.
2. Does inference-time scaling outrun efficiency? Google cut per-prompt energy 33× in twelve months. Reasoning models emit several times more tokens per request. Those two curves are racing, and only one of them has a floor.
3. Does the heat ever become a product? 45–70 °C is an awkward temperature — too cool to be industrially useful, warm enough to matter. If waste heat is ever sold at scale, the factory metaphor stops being broken.
▲ ■ ● Every app you describe is manufactured by a building you will never see. Memory feeds Intelligence, Intelligence triggers Execution. Build one from a prompt →
🔗 Related Reading
The silicon and the fabs
- The History of NVIDIA and Jensen Huang — how a graphics company became the substrate of an industry
- What Is TSMC? — the pure-play foundry model that makes fabless silicon possible
- The ImageNet Moment — when GPUs became the hardware of machine learning
- The History of Cloud Computing — how data centers became rentable in the first place
- The History of Virtualization — carving one machine into many
The economics and the mechanics
- Reduce LLM Costs — the buyer-side playbook
- AI Agent Cost Optimization — why cost per task beats cost per token
- AI App Builder Pricing — what the abstraction actually costs
- Open-Source LLMs — the self-hosting comparison
- AI Reasoning Models Explained — why thinking longer costs more
- AI World Models Explained — inference-time scaling in depth
- System Design Explained — the distributed-systems fundamentals
- From Web Hosting to AI Infrastructure — what running racks actually felt like
Explore Taskade
🐑 Before you go
- 🏗️ Describe an app in a sentence and watch it get built — Taskade Genesis
- 🤖 Give it agents that run without you — AI Agents
- 🔁 Wire it to everything else you use — Integrations
- 🌍 See what other people shipped — Community
🔗 Resources
- IEA, Energy and AI — iea.org/reports/energy-and-ai
- Lawrence Berkeley National Laboratory, United States Data Center Energy Usage Report: 2025 Update, 18 June 2026 — escholarship.org/uc/item/33m6w3x0
- Google Cloud, Measuring the environmental impact of AI inference, 21 August 2025 — cloud.google.com
- Epoch AI (Josh You), How much energy does ChatGPT use?, 7 February 2025 — epoch.ai
- Lawrence Berkeley National Laboratory, Queued Up interconnection queue analysis — emp.lbl.gov/queues
- US Energy Information Administration, Annual Energy Outlook 2026 — eia.gov
- Stanford HAI, AI Index Report — aiindex.stanford.edu
- Google, 2026 Environmental Report, 30 June 2026 — blog.google
- Microsoft, Environmental Sustainability Report — blogs.microsoft.com
- Uptime Institute, Global Data Center Survey — uptimeinstitute.com
- ASHRAE Technical Committee 9.9, liquid cooling guidance — ashrae.org
- Li, Yang, Islam and Ren, Making AI Less "Thirsty", arXiv:2304.03271 — arxiv.org/abs/2304.03271
- OpenAI, Five new Stargate sites, September 2025 — openai.com
- Microsoft, Inside the world's most powerful AI datacenter (Fairwater), 18 September 2025 — blogs.microsoft.com
- Gartner AI-server electricity projections, via Tom's Hardware — tomshardware.com
- Introl, data-center liquid cooling and GPU infrastructure analyses — introl.com
- Data Center Dynamics, NVIDIA 800 VDC / 1 MW rack architecture at OCP 2025 — datacenterdynamics.com
- Environmental and Energy Study Institute, Data Centers and Water Consumption — eesi.org
💬 Frequently Asked Questions About AI Data Centers
What is an AI data center?
A facility built around AI accelerators rather than general-purpose CPUs. The defining characteristic is power density: an AI rack draws roughly 60 kW and a flagship rack-scale system about 120 kW, against roughly 10 kW for a general-purpose rack. That density forces liquid cooling, a larger electrical system, and a different building.
How is an AI data center different from a regular data center?
Six ways: six to twelve times the power per rack, liquid cooling instead of air, a high-bandwidth internal network that makes many chips act as one, accelerators rather than real estate as the dominant cost, siting driven by access to megawatts rather than proximity to users, and a faster hardware refresh cycle.
What is the largest AI data center in the world?
Depends on the verb. The largest operational single-site GPU cluster is xAI's Colossus in Memphis, at roughly 555,000 GPUs and about $18 billion of silicon. The largest planned campuses are bigger: Meta's Hyperion in Louisiana targets 5 GW on 2,250 acres, and OpenAI's Stargate program targets more than 9 GW by 2029, with the 1.2 GW Abilene flagship partially live. Most "largest data center" claims silently switch between those two verbs.
How long does it take to build and power an AI data center?
The shell takes roughly 18 to 30 months; the grid connection takes 4 to 7 years (about 7 in PJM territory, 3 to 4 in ERCOT). Because the power arrives years after the building, operators increasingly bring their own: on-site gas turbines can be running in 12 to 18 months, which is why brand-new AI campuses hum. Small modular reactors, at 5 to 10 years out, are a next-decade answer.
Why do AI data centers need liquid cooling?
Because air runs out of capacity around 30 kW per rack and flagship AI racks draw about 120 kW. Per unit of volume, water carries roughly 3,500 times more heat than air, so removing 120 kW takes about 21,000 CFM of air or about 46 gallons per minute of water. NVIDIA's flagship rack-scale systems require liquid cooling rather than offering it as an option.
What is an AI factory?
A common industry term for a data center dedicated to producing AI output, framing tokens as a manufactured product. The economic half of the metaphor holds — tokens are fungible and priced per unit. The physical half does not: a factory's raw material becomes its product, while an AI data center converts essentially all of its electricity into heat and emits tokens as a side effect.
What is the difference between training and inference?
Training is one enormous synchronous job that builds a model, tolerates latency, and can be sited anywhere with power. Inference runs the finished model for users, is latency-sensitive, and wants to be near them. Training happens once per model; inference happens billions of times a day, which is why it is now the larger share of AI compute.
What is HBM and why does it matter?
High-bandwidth memory is stacked memory placed directly beside the processor on the same package. It matters because generating each token requires reading model weights out of memory, so text generation is limited by memory bandwidth rather than arithmetic. HBM capacity and bandwidth, not raw compute, set how many users a single accelerator can serve.
What is NVLink used for?
Connecting the GPUs inside a single rack so they behave as one machine with a shared address space. It is the "scale-up" fabric. A separate "scale-out" fabric — InfiniBand or high-speed Ethernet — connects racks into a cluster. The two solve different problems and fail in different ways.
What is tokens per second and why does it matter?
It is the throughput of an AI system — the rate at which it produces output — and it is becoming the industry's preferred unit of useful work. Microsoft reports about 865,000 tokens per second from a single Fairwater rack, and NVIDIA's GB300 NVL72 has demonstrated roughly 2.5 million tokens per second on DeepSeek-R1. It matters because it is the numerator of tokens per watt: since all the electricity becomes heat anyway, the only real efficiency lever is more tokens per joule.
What is the biggest bottleneck in an AI data center?
Outside the fence, the grid connection — over 2,060 GW of capacity sat in US interconnection queues at the end of 2025, with a typical wait near five years, so time-to-power sets the schedule. Inside the fence, memory bandwidth — each generated token requires reading the model's parameters out of high-bandwidth memory, so decode speed is set by bytes per second, not arithmetic. Both constraints are harder to buy your way out of than chips.
Who builds AI data centers?
Five supplier layers: foundries fabricate the silicon, accelerator designers design the chips, memory makers supply high-bandwidth memory, system integrators build and plumb the racks, and equipment makers supply the electrical and cooling plant — with cloud and colocation operators running the finished facility. In 2026 the binding constraint sits in the power layer rather than the chip layer.
Do I need to understand any of this to use AI tools?
No. The point of the abstraction is that you rent the building by the token. Three things are worth knowing because they affect what you pay: long context is the expensive part of a request, agentic loops turn one instruction into many inference calls, and repeated context can often be cached. Everything else is someone else's four-year interconnection queue.
Where can I see what AI data centers are actually producing?
The Taskade community gallery is one place — apps built from a prompt, running on exactly the machinery described above. Taskade Genesis is where you can build one yourself and see the output side of the stack without touching any of the infrastructure.