






In October 2012, a Stanford PhD student published a blog post arguing that computer vision was hopeless. He titled it "The state of Computer Vision and AI: we are really, really far away." He was not a crank. He was Andrej Karpathy, working under Fei-Fei Li, the researcher whose lab had built ImageNet in the first place.
Weeks earlier, the field he was calling hopeless had cracked open.
That overlap is the most interesting thing in the history of machine perception, and almost nobody tells it properly. Both facts are true at once: the benchmark fell off a cliff, and the person closest to the work was right that the hard part had not been touched. Understanding why they are both true is the single most useful lesson available for anyone reading an AI benchmark chart in 2026.
TL;DR: In 2012 AlexNet cut ImageNet top-5 error from 26 percent to 15.3 percent, against 26.2 percent for the runner-up. Weeks later Karpathy wrote that vision was "really, really far away" — and on scene reasoning he was right. The famous "5.1 percent human baseline" is one self-trained annotator, not humanity. See how every benchmark saturates.

What Was the ImageNet Moment?
The ImageNet moment was September and October 2012, when a deep convolutional neural network named AlexNet won the ImageNet Large Scale Visual Recognition Challenge with a top-5 error rate of 15.3 percent against 26.2 percent for the second-place entry. Best-in-class error had crawled from 28 percent in 2010 to 26 percent in 2011. A 10-point drop in one year is not tuning. It is a different method.
The dataset itself came first. ImageNet came out of Fei-Fei Li's lab in 2009 and grew to roughly 14 million hand-labelled photographs organised into categories, and the challenge ran annually from 2010 to 2017. Before that, computer vision research ran on datasets small enough that hand-designed feature extractors were competitive. ImageNet was large enough that learned features could win, and in 2012 they did.
What changed was not the idea. Neural networks had been around for decades and backpropagation since 1986. What changed was that Alex Krizhevsky got a deep network to train efficiently on consumer GPUs, on a dataset big enough to reward depth. That is the whole recipe of deep learning in one sentence, and it is why 2012 reads as a starting line rather than a step.
How Fast Did the Benchmark Actually Fall?
Faster than anyone had planned for. Top-5 error went 28 percent (2010) to 26 percent (2011) to 15.3 percent (2012), and by the 2014 challenge GoogLeNet reported 6.7 percent on the full test set. Four years took the number down by roughly 76 percent, and the steepest single drop was the year the method changed.
| Year | Winning top-5 error | Runner-up | What it signalled |
|---|---|---|---|
| 2010 | 28% | — | Hand-designed features, incremental era |
| 2011 | 26% | — | Two points in a year, business as usual |
| 2012 | 15.3% (AlexNet) | 26.2% | Method change, not tuning |
| 2014 | 6.7% (GoogLeNet) | — | Depth and architecture search compound |
The 2012 row is the one people quote, and the gap column is why. In a mature competition, the winner usually edges out the field. A gap of nearly 11 points between first and second place means the top entry was not playing the same game. Everyone in the room understood that immediately, which is how a single leaderboard result reorganised an entire research field inside about a year.
For the longer arc of how benchmarks are built, gamed, and retired, the full history of AI benchmarks walks the same cycle across a dozen datasets.
Why Did Karpathy Say Vision Was "Really, Really Far Away"?
Because he was measuring a different task. On 22 October 2012, weeks after AlexNet's result, Karpathy published a post built around one photograph: a man standing on a bathroom scale, while Barack Obama quietly presses his own foot down on the back of it, and the room behind them laughs.
He then enumerated ten separate things a machine would need to know to understand why that is funny. Not to caption the image. To get the joke. Among them:
- That some of the figures in the frame are mirror reflections, not additional people
- That a scale measures weight, and that a foot on it adds weight
- That the man on the scale cannot see what is happening behind him
- That people are self-conscious about their weight
- That the onlookers understand the situation and find his confusion funny
- That the person doing it is the President, which makes it funnier still
- That gravity, physical contact, and body position all connect in a specific causal chain
Then the line that has aged better than anything else in the post:
"How can we even begin to go about writing an algorithm that can reason about the scene like I did?"
And, mid-paragraph, the sentence people remember: "In any case, we are very, very far and this depresses me. What is the way forward? :(" He signed off with a joke about giving up and doing a mobile app startup, which is worth knowing before anyone paints the post as pure despair.
Here is the thing. He was right. AlexNet had just demonstrated something extraordinary about object recognition — mapping pixels to one of a thousand nouns. Karpathy was writing about scene understanding — physics, intent, social awareness, humour. Those are different tasks that happen to use the same input. The benchmark had moved; the thing he cared about had not.
This is the core confusion the whole article is about. A benchmark measures a task. People read it as a capability. The distance between those two things is where every misreading of AI progress lives, including the ones being made right now about reasoning models and AI agents in production.
What Happened When a Human Competed Against a Machine?
A trained human narrowly beat the machine in 2014, and the methodology behind that result matters far more than the score. Nobody actually knew what a human error rate on ImageNet was, so Karpathy made himself the control group: he built a labelling interface, trained himself on 500 validation images to learn the 1,000 categories, and then hand-labelled a random sample of 1,500 test images — not a difficulty-selected sample, a random one.
His top-5 error came in at 5.1 percent. GoogLeNet's on that same sample was 6.8 percent. A gap of roughly 1.7 points, significant at p equals 0.022. The human won.
Two precision notes that get lost every single time this story is retold. First, GoogLeNet's official 2014 challenge result was 6.7 percent on the full test set — a different measurement from the 6.8 percent on the shared 1,500-image sample, and the two should never be mixed. Second, Karpathy titled his write-up "What I learned from competing against a ConvNet on ImageNet," but he was never an official challenge entrant. It was a self-run experiment, published openly, with methodology attached.
Then he wrote the sentence that turned out to be the accurate prediction:
"It is clear that humans will soon only be able to outperform state of the art image classification models by use of significant effort, expertise, and time."
Why Is "5.1 Percent Equals Human-Level" Wrong?
Because 5.1 percent was one obsessively self-trained annotator, and the paper it comes from says so explicitly. The same work reports a second expert annotator scoring 12.0 percent top-5 error on a 258-image subset where GoogLeNet scored 5.8 percent — the machine beating that human by more than two to one. The number escaped into the literature as a fixed constant anyway.
This is the payoff of the whole story, so it is worth being slow about it.
| Annotator or system | Sample | Top-5 error | What it actually tells you |
|---|---|---|---|
| Annotator A (Karpathy, self-trained on 500 images) | 1,500 random test images | 5.1% | What one motivated expert achieves with heavy practice |
| GoogLeNet, same sample | 1,500 random test images | 6.8% | A 2014 model on the identical images |
| Annotator B (a second expert annotator) | 258-image subset | 12.0% | The same "human" label, more than 2x worse |
| GoogLeNet, same subset | 258-image subset | 5.8% | The machine beating that human decisively |
| GoogLeNet, official challenge | Full test set | 6.7% | The number to quote for the 2014 result |
Read the third and fourth rows together. On the same images, "human performance" was 12.0 percent and machine performance was 5.8 percent. If the field had happened to canonise Annotator B instead of Annotator A, the entire "models surpassed humans in 2015" narrative would have been dated to 2014 and told with the opposite emotional charge.
Karpathy's own framing is the correction, and it deserves to be quoted more than the number it refutes:
"Human accuracy is not a point. It lives on a tradeoff curve."
A human error rate is a function of training time, domain expertise, interface quality, fatigue, and how much the person cares. Untrained lab members in the same study ran far worse — and on a pruned, modified interface, a detail almost always stripped out when people quote the range. There is no single number. There is a curve, and someone picked a point on it and called it a constant.
The paper that produced the most-cited human baseline in machine learning contains, in its own results section, the refutation of the way it would be cited. That is not a scandal about one paper. It is what happens to every headline number once it stops travelling with its methodology.
What Did the Error Breakdown Reveal?
The mistake types matter more than the totals. Roughly 37 percent of the human's errors were fine-grained category confusions — the wrong dog breed, the wrong mushroom, the wrong species of bird — compared with about 7 percent of GoogLeNet's. By 2014, on the specific task of telling similar categories apart, the machine was already better than a trained human.
| Error type | Human (Annotator A) | GoogLeNet | Who is better |
|---|---|---|---|
| Fine-grained category confusion | ~37% of errors | ~7% of errors | Machine, clearly |
| Multiple objects, ambiguous target | Lower | Higher | Human |
| Small or low-visibility objects | Lower | Higher | Human |
| Scene context and intent | Not measured by ImageNet at all | Not measured | Human, by a mile |
So the honest summary of 2014 is not "human beats machine" or "machine beats human." It is: the machine had already won the fine-grained recognition contest, the human still won on context and ambiguity, and the thing the human was uniquely good at — the joke about the President's foot on the scale — was not on the test at all.
Fourteen years after AlexNet, that split is still the useful frame for judging any AI system. What is it measurably better at than a person? Where does it still need a person? And what does the benchmark not measure? That last question is the one that decides whether an AI agent survives contact with production. Our guide to agent evaluation covers how to write the missing test.
Why Does Benchmark Saturation Keep Happening?
Because a benchmark that works becomes the target, and a target stops being a measurement. ImageNet ran this cycle in eight years. GLUE ran it in about twelve months. The loop is structural, not a failure of any particular research community.
ImageNet took the healthy path. Winning error rates fell below what trained human annotators managed on the same task, the organisers judged the problem essentially solved, and the challenge was retired in 2017 rather than continued as a leaderboard where every serious entrant scored the same. Retiring a benchmark on time is rarer than it should be.
The unhealthy path is what happened to 5.1 percent. The number outlived its methodology, kept circulating as a constant, and became the thing new results were announced against.
In 2026 the same pattern is running one level up. A frontier model system card reports a graduate-level science benchmark at 94.1 percent and annotates the row "(saturated)". The lab is being honest — the annotation is right there — but the number still ends up on a slide. When a score is described as saturated by the people who produced it, it has stopped measuring the thing readers think it measures. That is the direct descendant of reading one annotator's 5.1 percent as the ceiling of human vision. If you are tracking how models are marketed against each other, our breakdown of the latest Claude model generation and the wider question of whether AI agents are overhyped both run on this same distinction.
What Should You Measure Instead of a Leaderboard?
Measure completed work on your own tasks, because per-step accuracy multiplies into something much worse over a long run. This is where benchmark reading does real damage in 2026: a model advertised at 99 percent per-step reliability is not a 99 percent reliable agent.
SERIAL RELIABILITY: why per-step scores mislead
───────────────────────────────────────────────────────────
  per-step      5 steps     10 steps    30 steps    50 steps
───────────────────────────────────────────────────────────
  99.0%          95.1%       90.4%       74.0%       60.5%
  98.0%          90.4%       81.7%       54.5%       36.4%
  95.0%          77.4%       59.9%       21.5%        7.7%
  90.0%          59.0%       34.9%        4.2%        0.5%
───────────────────────────────────────────────────────────
  A 30-step task at 95% per step finishes clean 1 run in 5.
  The per-step number never shows you that.
Chip manufacturing solved this framing decades ago by making yield — the fraction of units that come out usable — the master metric, not per-step precision. AI evaluation still reports accuracy almost exclusively. For anything multi-step, yield is the number that predicts whether work actually ships, and it is always uglier than the per-step figure suggests.
So the practical translation of the whole ImageNet story is a three-part discipline:
| Step | What to do | Why it matters |
|---|---|---|
| 1. Define correct first | Write down what a good result looks like before you measure anything | Karpathy trained on 500 images before scoring one. Undefined "correct" is how a number becomes a legend |
| 2. Use your own tasks | 20 to 50 real jobs from your actual work, not public test sets | Public benchmarks tell you a system is broadly capable, never that it does your job |
| 3. Score finished runs | Count complete tasks that shipped, not individual steps | Per-step accuracy hides serial collapse, as the table above shows |
Every production failure becomes a permanent test case. That is the entire method, and it is the same method Karpathy used in 2014 — build the interface, define the standard, label the sample, publish the methodology alongside the number. Our deeper guide to building an eval set covers the mechanics, and the evals entry gives the plain-English definition.
How Do You Run This Test on Your Own Work?
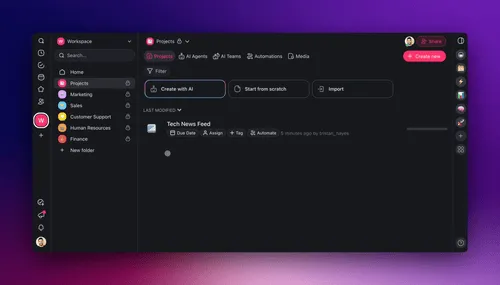
Run the same task through several models and judge the output against your own standard. Taskade gives you 15+ frontier models from OpenAI, Anthropic, Google, and open-weight providers, and you can switch the model behind an agent without rebuilding the agent — which makes a real head-to-head cheap enough to actually do.
A workable setup takes about an afternoon:
- Build the sample. Put 20 to 50 real tasks into a Taskade project — the actual requests, tickets, or documents your team handles. Any of the multiple project views (List, Board, Calendar, Table, Mind Map, Gantt, Org Chart) works; Table is usually easiest for scoring.
- Write the standard. One column for the expected result, one for what counts as a miss. Do this before you run anything, exactly like the 500-image training round.
- Run the same set through different models. Build a custom AI agent, point it at the task, and swap the model between runs. Learn Taskade covers agent setup step by step.
- Score completed runs, not steps. An automation can log each run's outcome back into the project so the score builds itself — see automation triggers for the wiring.
- Keep every failure. Each production miss becomes a permanent row. Your test set gets harder over time, which is the opposite of what happens to a public benchmark.
Because everything lands in the same workspace, the eval set becomes part of your Workspace DNA rather than a spreadsheet nobody opens: Memory holds the tasks and results, Intelligence runs them, and Execution logs the outcomes back. If you want to see what other people have built before starting your own, the Community Gallery has live apps you can open and clone, and AI Apps covers the building blocks.
Paid plans start at $10/month billed annually on Pro, with Business at $25/month billed annually for teams that need shared workspaces and more model access.
What Did the ImageNet Moment Actually Prove?
That scale plus learned representations beats hand-designed features, and nothing more than that. Everything else attributed to 2012 — that vision was solved, that human-level was 5.1 percent, that scene understanding followed automatically — is interpretation stacked on top of a single number from a single task.
Karpathy's career since is the argument in miniature. He went from that 2012 post to Tesla's Autopilot vision team, where his signature decision was architectural: stop processing eight camera feeds separately and stitching results downstream, and instead let one network learn a single representation from all inputs at once. Then OpenAI, then Eureka Labs, and in May 2026 to Anthropic, to build a group inside the pre-training team. The man who wrote "we are really, really far away" spent fourteen years closing exactly the gap he had described — and the gap he described is still the one that matters.
Because here is what has not changed. In 2014 the machine was better at dog breeds and the human still had the joke about the President's foot. In 2026 models write production code, clear graduate science exams, and still need a person to decide whether the answer was the right answer to the right question. The tasks moved. The shape of the split did not. Our histories of AI agents and AI coding tools both trace the same boundary from different angles, and metacognition covers the part machines are still worst at: knowing when they are wrong.
The practical takeaway is small and boring and works: measure on your own task, with your own data, and define what correct means before you measure. Karpathy did exactly that in 2014, which is why his number survived and the legend built on top of it did not.
Ready to run the test on your own work? Start free with Taskade — build an agent, point it at 20 real tasks, and score the output against your own standard rather than someone else's leaderboard. ▲ ■ ●
Frequently Asked Questions
What is the ImageNet moment in simple terms?
It is the moment in 2012 when a neural network beat every hand-engineered computer vision system on a large public image benchmark by a margin nobody could explain away. AlexNet reported 15.3 percent top-5 error against 26.2 percent for the second-place entry. That gap convinced the field that learned representations plus large data plus GPU training was the way forward.
Did AlexNet invent neural networks?
No. Neural networks date back decades, and backpropagation was published in 1986. AlexNet's contribution was engineering: getting a deep network to train efficiently on GPUs, on a dataset large enough that depth paid off. The idea was old, the execution was new, and the dataset made the difference. See machine learning for the underlying concepts.
Was Karpathy wrong to say vision was far away?
No, he was measuring a different task. AlexNet solved object recognition — mapping an image to one of a thousand category labels. Karpathy was writing about scene understanding: physics, intent, social context, humour. Those are different problems that share an input format. His post is a precise description of what object recognition does not give you.
Why do people keep citing 5.1 percent as the human baseline?
Because it was the first published human number on ImageNet and it travelled without its methodology. It came from one self-trained expert on a random 1,500-image sample. A second expert in the same study scored 12.0 percent on a subset where the model scored 5.8 percent. Any single figure for "human performance" is a point picked off a curve.
What is top-5 error?
Top-5 error is the percentage of images where the correct label does not appear in the model's five highest-confidence guesses. It was used instead of top-1 because ImageNet contains many visually similar categories and images containing multiple objects, so demanding a single exact answer would have penalised reasonable predictions.
How is this relevant to large language models?
The same cycle is running at a higher level. Benchmarks like MMLU and GPQA followed the ImageNet arc: hard at launch, headline number for a few years, then saturated. A 2026 system card reporting 94.1 percent and labelling the row saturated is the modern version of quoting 5.1 percent forever. Large language models inherit the measurement problem along with the capability.
What should replace public benchmarks for business decisions?
Nothing replaces them, but they should be the first filter rather than the decision. Use public scores to shortlist broadly capable systems, then build a fixed set of 20 to 50 real tasks from your own work and score candidates on that. Only your own set answers whether a system does your job, and the review process around it is what agent governance exists to formalise.
Why does agent reliability collapse on long tasks?
Because errors compound. Thirty steps at 99 percent reliability each finishes cleanly about 74 percent of the time. At 95 percent per step it drops to about 21 percent. Per-step benchmark accuracy never surfaces this, which is why long-horizon agent work fails in ways single-step scores do not predict. Agentic engineering is largely the practice of managing this.
Is human review still necessary if models beat human benchmarks?
Yes, and the ImageNet data shows why. GoogLeNet beat trained humans on fine-grained recognition in 2014 while still losing on ambiguous and context-dependent images — and scene reasoning was never on the test. Review belongs where the benchmark is silent, not where it is loud. See human in the loop for design patterns.
Where did ImageNet's labels come from?
From people. Roughly 14 million images were hand-labelled through crowdsourced annotation, which is why the dataset took years to build and why it was large enough to change what was possible. The lesson is durable: the pattern recognition breakthrough rested on an enormous, unglamorous labelling effort that came first.
What kinds of AI can Taskade run against my own test set?
You can build custom agents with their own instructions, knowledge sources, and tools, then swap between 15 or more frontier models behind them without rebuilding. Combine that with 100+ bidirectional integrations — triggers pull events in, actions push data out — and the results of each run can be logged automatically.
How much does it cost to start testing models this way?
The free plan is enough to build a small agent and run a first test set. Pro is $10/month billed annually for individuals who want more model access and higher limits, and Business is $25/month billed annually for teams sharing workspaces. You can start on free, build the eval set, and upgrade only when the volume justifies it.