





In 2016, Google's Site Reliability Engineering book defined a cascading failure as "a failure that grows over time as a result of positive feedback." That sentence is pure Donella Meadows — 1970s system-dynamics vocabulary, running today's production incident reviews. The same frame explains why your shower scalds you, why growth curves flatten, and how every AI agent you have ever used actually works.
Systems thinking is the practice of explaining behavior by the structure that produces it — the stocks that accumulate, the feedback loops that amplify or correct them, and the delays that make effects arrive late. Instead of asking "what caused this event," it asks "what structure keeps producing this pattern?"
This guide rebuilds the whole discipline from primary sources — Meadows' 1977 Dartmouth lecture, Thinking in Systems, the Club of Rome's own archive, and modern engineering docs — with every loop drawn as a live diagram. Eighteen of them. 🔮
TL;DR: Two loop types produce all the drama: reinforcing loops compound (odd fact: count the minus signs — an even number, including zero, means reinforcing) and balancing loops seek goals. Stocks change only through their flows. A balancing loop plus a delay is the recipe for oscillation. And when a growth curve flattens, nothing broke — an old loop just took over. Build a system that runs itself →
🔍 What Is Systems Thinking? The Two-Sentence Answer
Systems thinking explains behavior by structure. Where conventional analysis asks what caused this event, systems thinking asks what arrangement of stocks, loops, and delays keeps producing this pattern — and then changes the arrangement instead of chasing the event.
Meadows defined her subject twice in Thinking in Systems. Informally, in the introduction: "A system is a set of things—people, cells, molecules, or whatever—interconnected in such a way that they produce their own pattern of behavior over time." And precisely, in chapter one: "A system is an interconnected set of elements that is coherently organized in a way that achieves something."

Meadows' definition, made visible: elements (starlings), interconnections (each bird tracking its nearest neighbors), producing their own pattern of behavior — with no bird in charge. Photo: Skander zarrad, Wikimedia Commons, CC BY-SA 4.0.
| Fact | Detail |
|---|---|
| What it is | Explaining behavior by structure: stocks, flows, feedback loops, delays |
| Formal discipline | System dynamics — Jay Forrester, MIT Sloan, 1956 |
| Canonical thinker | Donella Meadows (1941–2001) |
| Canonical book | Thinking in Systems: A Primer (2008, posthumous) |
| Founding artifact | The World3 model behind The Limits to Growth (1972) |
| The famous essay | "Leverage Points: Places to Intervene in a System" (1999) |
| Core diagnostic | Behavior over time reveals the loop structure underneath |
| Why it matters now | WEF Future of Jobs 2025: #12 core skill, #11 fastest-rising — and every AI agent runs a feedback loop |
Last updated: August 2026 — every quote in this article is verified against the primary source: the 1977 Dartmouth lecture recording, the full text of Thinking in Systems, the Club of Rome's 50th-anniversary history, and the peer-reviewed Limits to Growth retrospectives. Several widely-circulated "Meadows quotes" fail that check — there is a whole section on those below.
One disambiguation before we start: systems thinking is not system design. If you came here for load balancers and database sharding, that discipline has its own explainer. And it is the complement — not the opposite — of hierarchical thinking, which decomposes problems into parts. Systems thinking is what you need when the parts are fine and the interactions are the problem.
| Question | Analytical answer | Systems answer |
|---|---|---|
| Why did this happen? | Find the triggering event | Find the structure that makes it recur |
| Where is the fault? | In a component | In the interaction between components |
| How do we fix it? | Repair or replace the part | Change a loop, a delay, or an information flow |
| Why did the fix not hold? | The repair failed | The system compensated — a loop pushed back |
🧬 From Whirlwind to World3: Where Systems Thinking Came From
Systems thinking has an unusually precise origin: one engineer, one institution, one decade. Jay Forrester (1918–2016) led MIT's Project Whirlwind, where his work on early digital computing led him to invent magnetic core memory in 1949 — an early form of RAM he held the patent on. In 1956 he joined what became the MIT Sloan School of Management and asked what would happen if you applied feedback-control engineering to corporations, cities, and eventually the world. The result was system dynamics: Industrial Dynamics (1961), Urban Dynamics (1969), World Dynamics (1971).
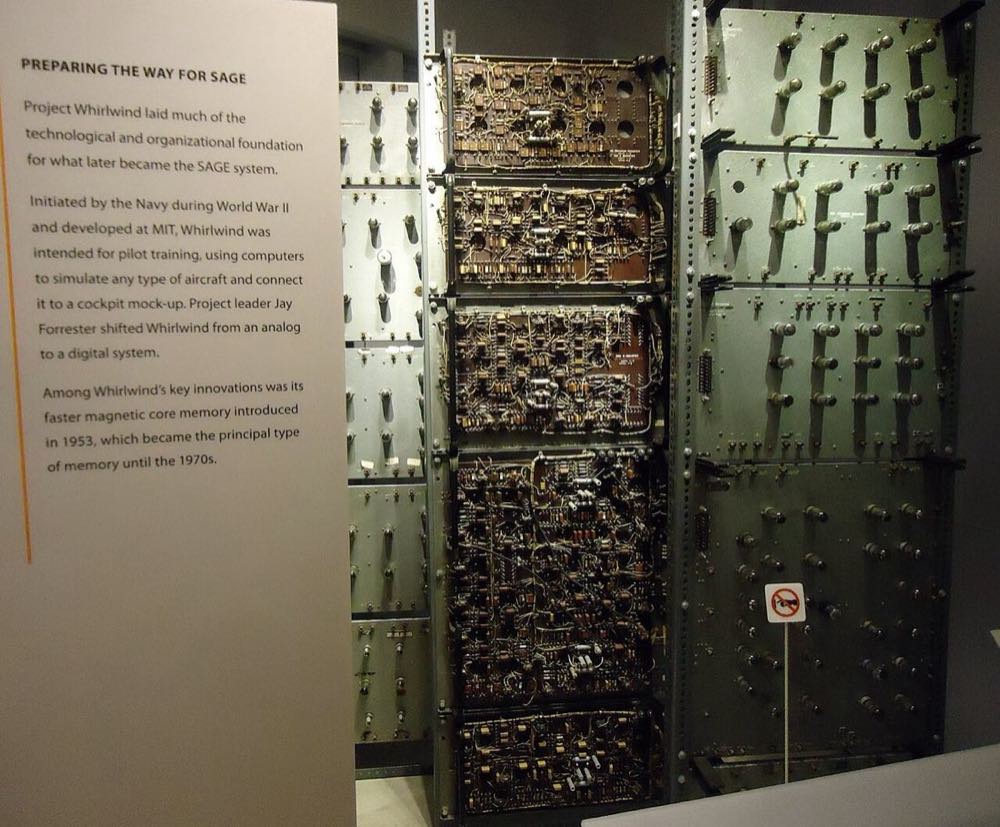
Where the feedback vocabulary comes from: a section of Forrester's Whirlwind — the machine whose engineering problems led him to core memory, and whose control-loop thinking led him to system dynamics — at the Computer History Museum. Photo: Tomwsulcer, Wikimedia Commons, CC0.
Donella Meadows, the teacher
Donella "Dana" Meadows came to the field from science: a chemistry B.A. from Carleton College in 1963, a Ph.D. in biophysics from Harvard in 1968, then a research fellowship at MIT in Forrester's system dynamics group. In August 1970, the Club of Rome — founded by Italian industrialist Aurelio Peccei — commissioned a small MIT team to model the long-term interaction of population, industry, food, resources, and pollution. Meadows became the project's lead author at age 30.
The result, The Limits to Growth (1972, with Dennis Meadows, Jørgen Randers, and William Behrens III), became one of the most argued-about books of the century — by the Club of Rome's own account, "eventually selling well over 3 million copies in 35 languages."
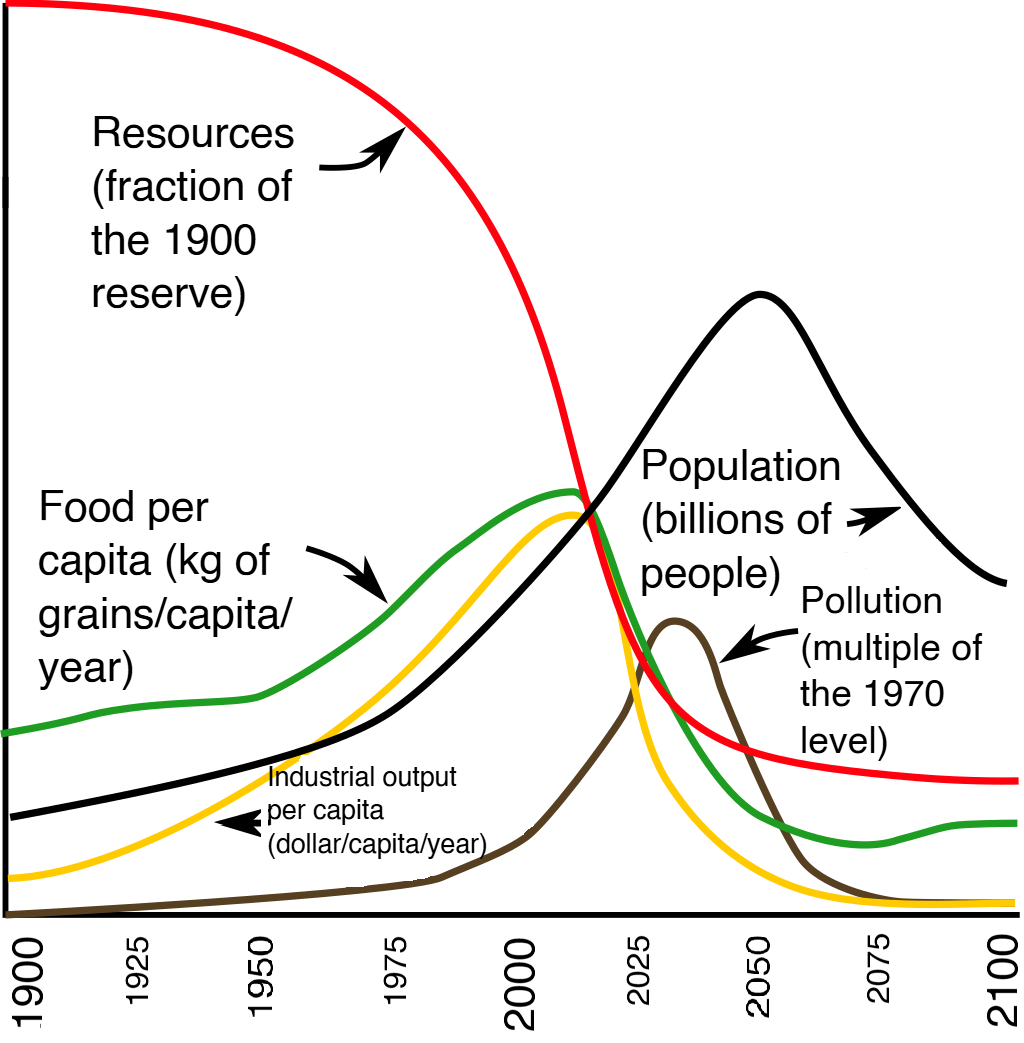
The most argued-about output a stock-and-flow model has ever produced: the World3 standard run. Every curve is a stock; every slope is a pair of rates. Chart: Kristo Mefisto, Wikimedia Commons, CC BY-SA 4.0.
Meadows then taught in Dartmouth College's Environmental Studies program for 29 years, from 1972 until her death in February 2001, at 59, after a sudden bacterial meningitis infection. Along the way: a Pew Scholarship in 1991, a MacArthur Fellowship in 1994, and more than 700 installments of her syndicated column The Global Citizen, which was nominated for a Pulitzer Prize in 1991.
The 1977 lecture this article is built on
In spring 1977, Meadows delivered a Dartmouth lecture called "A Philosophical Look at System Dynamics" — now publicly viewable thanks to the Donella Meadows Project. It is the sharpest version of the material, because it is about the assumptions underneath the method, and it opens with a warning that describing them is nearly impossible:
"It's kind of like describing the lenses in your eyes, which you never see, you only see through. Modeling philosophies are very much that way."
That sentence applies to every model you run without naming it — the postmortem template, the funnel report, the retry policy. Each embeds assumptions about what causes what. You do not see them. You see through them.
The lecture is organized around four pillars, and so is the rest of this article: causal links (what an arrow may mean), feedback loops (the closed chain and its two signs), stocks and rates (the claim that there are only two kinds of thing), and structure ↔ behavior (the payoff).
| Year | Event |
|---|---|
| 1949 | Forrester invents magnetic core memory at MIT's Project Whirlwind |
| 1956 | Forrester joins MIT Sloan; system dynamics is born |
| 1970 | Club of Rome commissions the MIT world-model study |
| 1972 | The Limits to Growth published; Meadows begins teaching at Dartmouth |
| 1977 | "A Philosophical Look at System Dynamics" lecture |
| 1990 | Peter Senge's The Fifth Discipline takes systems thinking to business |
| 1993 | Meadows completes the Thinking in Systems manuscript |
| 1997 | "Places to Intervene in a System" — nine points — in Whole Earth |
| 1999 | The twelve leverage points, Sustainability Institute paper |
| 2001 | Meadows dies at 59, in Hanover, New Hampshire |
| 2008 | Thinking in Systems published posthumously, edited by Diana Wright |
| 2016 | In a World of Systems animation (David Macaulay, Linda Booth Sweeney) |
| 2025 | WEF Future of Jobs ranks systems thinking #12 among core skills |
The through-line to today is direct: MIT's obituary for Forrester notes that four of his students wrote The Limits to Growth, and the same loop vocabulary now describes sixty years of AI agents converging on one architecture.
➡️ Causal Links: What an Arrow Is Allowed to Mean
The discipline starts with a rule about arrows: you may draw A → B only if you can name the real-world mechanism by which A changes B. Meadows was blunt about the standard: "You should be able to ask a system dynamicist, what cause do you mean by that arrow, and he should be able to tell you what mechanism you had in mind." The gold standard is an arrow so obvious it is nearly definitional — births → population. The moment a deer is born, it is a member of the deer population.
The correlation trap
The lecture works a real example: a 1971 scatter plot of doctors per 100,000 people against vegetable calories per person per day, one point per country. There is a clear correlation. So which way does the arrow go?
Neither. Meadows' answer is that the two are "correlated, not causally related" — both are driven by an unnamed third variable, something like industrial development. The correct move is not to pick a direction. It is to introduce the confounder as a node and hang both observed variables off it.
The trap is that the wrong model works — right up until you act on it. A model wiring food directly to doctor counts will reproduce history perfectly and then confidently predict that shipping food raises the number of doctors. That is the failure mode of every correlational model: it fits history and lies about interventions.
| What you observe | The tempting arrow | The honest structure | What the wrong model predicts |
|---|---|---|---|
| Doctors and calories correlate across countries | food → health services | development → both | Shipping food raises doctor counts |
| Feature usage correlates with retention | feature → retention | engaged-user type → both | Forcing the feature on everyone lifts retention |
| Meetings correlate with project slippage | meetings → slippage | project trouble → both | Banning meetings rescues the deadline |
Nonlinearity is the default
The second scatter plot bends: life expectancy rises steeply with food per capita at the low end and barely at all at the high end. The first few doctors and hospitals move life expectancy enormously; the hundredth hospital moves it approximately zero.
Meadows' attitude toward this is the one worth stealing: "We very often make them nonlinear. We expect them to be nonlinear. We sort of rejoice in nonlinear relationships." A saturating curve is not an inconvenience to be linearized away — it is where the interesting behavior lives, because a nonlinearity is the mechanism by which a loop's strength changes as the system's state changes. Hold that thought; it becomes loop dominance below.
Delays, and why the time horizon decides
The third thing to check on every arrow is elapsed time. Money spent on agriculture does not become food this season; a newborn takes about seventy years to reach the age of high mortality risk — age structure is a delay.
And whether something even counts as a delay depends entirely on the model's time horizon. On a 200-year model, a two-year lag is instantaneous; on a one-week model of a family's eating habits, the time food spends in the refrigerator matters. The consequence is easy to miss and worth writing down: the time horizon is not a presentation choice made at the end. It must be fixed before you can decide which arrows carry delays. Choosing the horizon is choosing the model.
🔁 How Feedback Loops Actually Work
A feedback loop is a closed chain in which the state of a system informs a decision that then changes that same state. Every specific loop — thermostat, market, ecosystem, agent — is an instance of one universal diagram, and half of it is invisible.
The visible half is the one everyone already draws: action changes the world. Meadows called it "the politician's point of view. I'm going to do a policy and it's going to change things. I'm going to build roads and it's going to decrease highway congestion." The invisible half is her field's contribution: those decisions are made by reading the state of the system. Some information causes the decision to be what it is — and that return path closes the loop.
The ultimate feedback loop. The dashed line is the half nobody draws — and, as we will keep seeing, the half where expensive failures live.
The alternative has a name: the open-loop view — "an input, a big black box where a lot of stuff happens, and then an output." An open-loop decision is made without reading the state it affects, which means it has no reason to converge on anything.
Meadows described the habit this diagram instills as a personal tic: "Whenever I hear anybody say, especially politicians, A causes B, I'm always asking myself, how does B come back around to influence A again?" That one question is most of the discipline. It is also — as we will see below — a precise description of how every AI agent works.
⚖️ Reinforcing vs Balancing Feedback Loops
There are exactly two kinds of feedback loop, and they produce opposite behavior: balancing loops seek a goal; reinforcing loops compound. Everything a system does over time is some combination of the two.
The beer glass: a balancing loop
Meadows' teaching example is a keg, a glass, and a hand. The state is the level of beer in the glass; the goal is the level you want; the action is the spigot; the information link is your eyes, reporting the gap. Open the spigot and the level rises; as the level approaches the goal, you close the spigot. The loop is goal-seeking: knock the level down and the loop restores it.
A balancing loop, labeled B. One negative link — the closer you get to the goal, the less you pour — makes the whole loop corrective.
Her aside about this example is quietly the best lesson in the lecture: "Assuming you haven't had too many glasses already, there's not much of a delay in your perception of where the level actually is, and so you do a very good job of controlling that system." The controller is only as good as the latency of its information link. Degrade perception, and the identical structure starts to overshoot. That is the entire theory of monitoring, dashboards, and observability, stated over a beer in 1977.
The bank balance: a reinforcing loop
Money in the bank earns interest; the interest is added to the money; more money earns more interest. Note what is not required: the interest rate is a constant. The loop does not need a growing parameter to produce growth.
Growth comes from the structure, not from any element inside it. That is the whole thesis of systems thinking in miniature — and it is why hunting for "the thing that changed" when a metric explodes is often futile. Nothing changed. The loop was always there.
A reinforcing loop, labeled R. Zero negative links. The output feeds the input, and a constant rate still produces an exponential curve.
This is also the mechanism behind compounding habits: a 1% improvement is a small constant rate on a growing stock, and the structure does the rest.
Count the minus signs — then walk the loop anyway
The mechanical rule: multiply the signs around the loop. An odd number of negative links makes it balancing; an even number — including zero — makes it reinforcing.
But Meadows insisted on a second, independent check: narrate the loop out loud in both directions and see whether a disturbance is fought or amplified. The arithmetic is right about the diagram you drew; only the walk-through tells you whether you drew the system you actually have. In production practice, the walk-through is exactly what a generator-checker-gate pipeline does for an agent's work: a second, independent read of the same loop.
| Property | Reinforcing (R) | Balancing (B) |
|---|---|---|
| Negative links | Even, including zero | Odd |
| Behavior signature | Exponential growth or collapse | Goal-seeking, asymptotic |
| Everyday example | Compound interest, word of mouth | Thermostat, filling a glass |
| Software example | Viral invites, retry storms | Autoscaling, rate limits |
| Failure mode | Runaway | Stuck at the wrong goal |
| What changes it | Weaken the gain, open the loop | Move the goal, fix the sensor |

The balancing loop you can buy in a hardware store: Honeywell's 1953 T-86 Round — sensor, goal, and actuator in a single dial. Photo: Cooper Hewitt, Smithsonian Design Museum, public domain.
🛁 Stocks and Flows: Bathtub Logic
A stock is anything that accumulates and is measured at an instant. A flow is a rate that changes a stock, measured over an interval. A stock can only change through its flows — there is no other door.
Bathtubs 101
Meadows opens Thinking in Systems with the canonical example: "Imagine a bathtub filled with water, with its drain plugged up and its faucets turned off—an unchanging, undynamic, boring system." Open the drain and the stock falls; open the faucet too and the level becomes the running difference between two rates. Everything interesting a system does begins with this picture.
The bathtub. Clouds mark the model's boundary; the dashed lines are you, reading the level and deciding.
The whole grammar fits in one sketch — worth pinning above any dashboard you own:
                 faucet  (inflow: 8 L/min)
                    |
                    v
      +---------------------------------+
      |  ~ ~ ~ ~ ~ ~ ~ ~ ~ ~ ~ ~ ~ ~ ~  |
      |  ~ ~   STOCK: 120 L    ~ ~ ~ ~  |   measured at an instant
      |  ~ ~ ~ ~ ~ ~ ~ ~ ~ ~ ~ ~ ~ ~ ~  |
      +---------------+-----------------+
                      |
                      v
                 drain  (outflow: 5 L/min)  net rate  =  8 - 5  =  +3 L/min   ->  the stock is rising
  stock(t+1) = stock(t) + inflow - outflow      <- the only door
Levels and rates: the sharper definition
The 1977 lecture defines the same pair by their role in the loop rather than their units, and the phrasing is better than anything in the book:
"A level is what people look at to make decisions, and the rate is the decision itself."
A level accumulates and gets sensed. A rate gets decided, and it changes a level. Everything else in the notation is bookkeeping. This definition also produces the single most useful review question in the discipline, one worth asking of every counter, queue, and budget you ever create: what drains it? A stock with an inflow and no outflow is not a metric — it is a slow-motion incident.
Dynamic equilibrium: stable is not static
A stock is stable when its rates match, not when nothing is happening. A fishery holds steady when reproduction matches fishing plus natural death; a team's backlog holds steady when intake matches completion. The stillness is an illusion produced by two opposing torrents — which is why "nothing is changing" and "nothing is happening" are entirely different claims about a system.
| Domain | Stock | Inflow | Outflow |
|---|---|---|---|
| Bathroom | Water in the tub | Faucet | Drain |
| Finance | Account balance | Deposits, interest | Spending |
| Team | Headcount | Hiring | Attrition |
| Delivery | Work in progress | Tasks started | Tasks shipped |
| Knowledge | Notes in a second brain | Capture | Archive / decay |
| AI workspace | Accumulated context | Every completed loop | Pruning, summarization |
The physical world runs on the same picture: behind every AI answer sits a literal chain of flows — grid to coolant loop to rack — with electricity as the inflow and heat as the outflow.
🗺️ How to Draw a Causal Loop Diagram
You need exactly eight symbols, and you already know most of them from this article's own diagrams. The notation comes from DYNAMO, the simulation language Forrester's group built, but the sketch version works on any whiteboard.
| Symbol | Meaning | Note |
|---|---|---|
| Box | Stock (level) | The thing that accumulates and gets looked at |
| Valve | Rate (flow) | The decision; regulates a flow |
| Cloud | Model boundary | The infinite keg; where stuff comes from and goes |
| Circle | Auxiliary | A rate equation split into readable steps |
| Double line on arrow | Nonlinearity | This relationship bends |
| Box on an arrow | Delay | Effect lands later than cause |
| Solid arrow | Material flow | Stuff actually moving into or out of a stock |
| Dashed arrow | Information flow | State being read by a decision |
Solid vs dashed: the distinction that matters most
The two arrow types separate what moves from what is known — and almost every interesting failure in a real system is a failure on a dashed line. The stock is fine, the actuator is fine, but the decision is running on information that is stale, aggregated wrong, or silently no longer arriving. The beer drinker is a good controller because the dashed line is fast and accurate. Break the sensor and the same structure oscillates or runs away — with every component individually healthy.
How to read a standard causal loop diagram
Out in the wild — textbooks, consulting decks, Wikipedia's causal loop diagram entry — you will meet a leaner dialect than this article's stock-and-flow sketches. Every arrow carries a polarity: + (sometimes s, for "same") means the variables move in the same direction; − (or o, "opposite") means they move opposite ways. Each closed loop is stamped R for reinforcing or B for balancing, decided by the minus-count rule you already know: odd number of negative links = B, even = R. Delays are drawn as two short hash marks across an arrow. Same grammar, lighter notation — everything in this article translates one-to-one.
Draw honestly, then break the rules
Meadows taught the notation with a rule that ranks above the notation itself: "It's more important to have the model represent the world correctly than it is to have the model follow the rules of the method correctly." Or, as she put it: "First we start you pure and then we tell you how to get impure."
Every diagram in this article is written as text and rendered live — the same diagrams-as-code approach you can use for your own loop sketches, which keeps them in version control next to the decisions they explain.
⏳ Delays: Why the Shower Scalds You
A balancing loop plus a delay is the standard recipe for oscillation. The controller acts on a stale reading of the gap, overshoots, sees the new gap late, and over-corrects the other way.
The 2016 animation In a World of Systems — narrated and illustrated by David Macaulay with systems educator Linda Booth Sweeney for the Donella Meadows Project — makes this concrete with a shower. The person adjusting the handle senses the gap between actual and desired temperature. But the hot water takes time to travel through the pipes, so the reading always lags the action. The animation is careful about a point Meadows also insisted on: the person is part of the system, not an operator standing outside it — and so is the delay.
Every step is rational. The oscillation is produced by the structure, not by the person — which is the whole point.
The delay is not a flaw in the person; it is a property of the loop. The fix is never "try harder." It is either shorten the delay (move the heater closer), damp the response (smaller moves, wait out the lag), or improve the information link (a thermometer at the valve). Keep those three in mind — they reappear as leverage points below.
The Beer Game: how a blip becomes a bullwhip
The most famous demonstration of delay-driven oscillation is a board game. The Beer Game, developed at MIT Sloan in the early 1960s out of Jay Forrester's system dynamics group and still played in business schools today, puts four players in a supply chain — retailer → wholesaler → distributor → factory — where each tier sees only the orders arriving from the tier below, and shipping and order-processing delays sit between every pair.
Then customer demand ticks up slightly, once. The retailer orders a bit more. The wholesaler, seeing a jump, orders more still, plus safety stock. By the time the signal reaches the factory it has become a phantom boom — followed by a phantom bust when the over-ordered inventory finally lands. This amplification is the bullwhip effect, and it wrecks teams of professional supply-chain managers as reliably as students. Nobody plays badly; the structure plays them — each tier is a rational balancing loop acting on delayed, secondhand information, which is the shower with four people holding the handle.
Customer demand (the flat line) rises by one case in week 2 and never changes again. Factory orders (the whiplash) boom and bust on that single blip — every extra swing is manufactured by delays in the loop, not by the market.
The classical fix is not better forecasting at each tier — it is sharing the information: give every tier the retailer's actual point-of-sale data, and the phantom signal never forms. That is leverage point #6, information flows, doing in a supply chain exactly what the road sign does in the traffic jam below.
📊 Four Structures, Four Behaviors: Reading Curves Backwards
The payoff of everything so far is a lookup table between structure and behavior. Meadows called this the most important idea in the lecture: "when we've come this far in analyzing a system, we gain a lot of knowledge about how a structure of interrelationships generates a dynamic behavior." In the book she compressed it further: "System structure is the source of system behavior. System behavior reveals itself as a series of events over time."
| Structure | Behavior over time |
|---|---|
| Reinforcing loop alone | Exponential growth — or exponential collapse |
| Balancing loop alone | Goal-seeking; asymptotic approach from either side |
| Reinforcing + balancing, no delay | S-curve: R runs the early phase, B runs the late phase |
| Reinforcing + balancing, with delay | Oscillation, overshoot — "or a lot of other things" |
Exponential (reinforcing alone), goal-seeking (balancing alone), and the S-curve (both, taking turns).
The fourth row of the table: the shower, the thermostat with slow pipes, the over-corrected forecast — ringing toward the goal.
The S-curve is two loops taking turns
Every adoption curve you have ever seen is the same two-loop machine: word of mouth is a reinforcing loop on the stock of users, and the shrinking pool of people who have not adopted yet is a balancing loop that was there from day one.
The S-curve machine. R dominates early, B dominates late — and the handoff is the interesting moment.
Sustained oscillation: rabbits, foxes, and Lotka–Volterra
Oscillation has a canonical ecosystem. In the 1920s, Alfred Lotka and Vito Volterra independently formalized predator–prey dynamics: more rabbits feed more foxes, and more foxes eat down the rabbits. The two stocks form one balancing loop between them — one negative link, so the pair is goal-seeking. The canonical equations contain no explicit delay term; the lag is built into the stocks themselves, because each population must accumulate or drain before the other feels the change, so each is always responding to where the other was. A balancing loop acting through two accumulating stocks behaves like the shower again, with fur: the system never settles, it chases, producing sustained, out-of-phase oscillation. The Hudson's Bay Company's lynx and snowshoe-hare pelt records — nine decades of them — remain the famous empirical trace of exactly this curve pair.
Two coupled stocks: the loop between them has one minus sign (balancing), each stock has its own internal loop, and each stock must fill or drain before the other feels it — an integration lag that needs no explicit delay term. Structure predicts behavior: a chase, forever.
The fox curve lags the rabbit curve by a quarter cycle — the delay made visible. Neither population is trying to oscillate; neither can stop.
Reading behavior backwards into structure
The table is meant to be run in reverse, as a diagnostic. Meadows described her own habit: see something growing exponentially, and immediately hunt for the positive feedback loop. See a system that is stagnant despite real effort to move it, and hunt for "a very strong negative feedback loop that's always pulling that system back to a goal" — a goal, crucially, that nobody has named out loud.
| You observe | Hunt for |
|---|---|
| Exponential growth or collapse | The reinforcing loop feeding itself |
| Stubborn stagnation despite effort | The balancing loop and its unnamed goal |
| Oscillation, ringing, boom-bust | The delay inside a balancing loop |
| Growth that rolls over and flattens | Nothing new — an old balancing loop taking dominance |
She was honest about the ceiling: intuition breaks down past a few coupled loops, and that is what simulation is for. But the first three rows of that table will carry you through most Monday-morning metric reviews unassisted.
The iceberg model: four layers of explanation
The diagnostic habit this section teaches has a famous packaging: the iceberg model. Events — the outage, the missed quarter, the argument — are the tip above the waterline, and reacting to them is all most organizations ever do. Beneath the surface sit three deeper layers: patterns (the same event, plotted over time — the behavior-over-time curves this whole section reads), structures (the stocks, loops, and delays generating the pattern), and at the bottom mental models (the beliefs that built the structure and quietly defend it). The rule of the iceberg is the same gradient as Meadows' leverage list: the deeper the layer you address, the more the system changes.
The iceberg, waterline at the top: only events are visible. Leverage grows with depth — parameters live near the surface, paradigms at the bottom, exactly matching the leverage-point ranking below.
One provenance note, in the spirit of this article's receipts: Meadows never drew an iceberg. The metaphor entered social science as Edward T. Hall's 1976 cultural iceberg, and was adapted for systems work in the community around Peter Senge's The Fifth Discipline — the lineage is traced by NPC's systems practice resources and Leading Sapiens' history of the model. But every layer maps cleanly onto her vocabulary, which is why it became the discipline's most-taught diagram: events are what open-loop thinking sees, patterns are behavior over time, structures are this article, and mental models are leverage points #2 and #1.
🏆 Loop Dominance: Why Growth Curves Flatten
A flattening growth curve is usually not a new problem. It is an old balancing loop — present from the beginning — becoming dominant. Nothing about the system changed except which loop is winning.
Loops inside loops: the oil model
Meadows warned her audience directly: "I don't want you to get the impression that loops occur singly. We may pick them out to look at singly, but in fact almost always we find loops embedded in loops and connected to loops." Her worked example is a fragment of a real energy model:
The outer loop has two negative links — an even number, so it is reinforcing: scarcity raises prices, prices fund exploration, exploration accelerates depletion. The dashed inner loop is balancing, and it is the one that eventually wins.
Walk it her way, in both directions. Plenty of reserves: cheap to find, low price, low revenue, little investment, slow discovery. Almost none left: expensive to find, high price, high revenue, heavy investment, faster discovery — drawing the remainder down faster still. That is the reinforcing loop. But there is a balancing loop hidden inside: as exploration gets more expensive, the amount found per dollar invested falls. Meadows' verdict on the industry's argument for deregulation captures both halves: "The gas and oil companies are partly right. If they had more money they'd discover more oil. But they're also partly wrong. There may not be any more oil to discover there... at some point this negative loop will dominate the system."
Loop dominance is the concept doing the work: the same unchanged structure grows exponentially while the reinforcing loop is stronger, then rolls over when the balancing loop takes over — and the handoff is driven by a nonlinearity getting steeper as the stock draws down. This is the honest explanation for most "the market matured" stories, and for why an AI bill can climb while unit prices fall — a reinforcing loop on call volume outrunning a falling parameter.
One more move from the same model: a price cap, in this notation, is not "a policy about prices." It is a cut in one link of a reinforcing loop — which is a structural claim you can examine, rather than a slogan you can only argue about.
The boundary problem
Asked how far to extend the model, Meadows gave the answer that every modeler eventually rediscovers: "The next change I might make would be, as the price goes high, people use less and therefore the demand is less and therefore, etc., etc. We can go on. The problem is not where to start, almost, it's where to stop."
Every model is a decision about a boundary. Loops always continue past the edge of the diagram. The skill is not exhaustiveness — it is choosing a boundary that contains the behavior you are trying to explain.
🪤 System Archetypes: Six Traps and Their Escapes
Certain loop structures recur so often, across so many domains, that they have names. Peter Senge's Fifth Discipline community calls them system archetypes; Meadows, in the traps chapter of Thinking in Systems, called them traps — and paired every one with an escape, because a trap that is a structure can be exited structurally. These six cover most of what you will meet at work:
| Trap | The structure | Tell-tale behavior | The escape |
|---|---|---|---|
| Tragedy of the commons | Every user's reinforcing gain loop draws on one shared stock; feedback from the eroding stock back to each user is weak or delayed | Total use grows steadily while the shared resource quietly drains, then crashes | Restore the missing feedback: meter it, price it, regulate it, or divide the commons |
| Shifting the burden | A symptomatic fix and a fundamental fix compete to relieve the same symptom; the quick one erodes capacity for the real one | Each round of the quick fix works a little less well; dependence grows | Use the quick fix only to buy time — and spend the time on the fundamental fix |
| Escalation | Two balancing loops, each party's goal set relative to the other's state | Ratcheting: price wars, ad-spend races, one-upped feature lists | One party refuses the relative goal, or both renegotiate the reference point |
| Success to the successful | The winners' rewards fund the next round's advantage — a reinforcing loop on winning itself | Gaps widen; early leads harden into monopolies | Level the starting line each round; decouple this round's prize from the next round's odds |
| Policy resistance | Several actors' balancing loops pull the same stock toward different goals | Enormous effort, near-zero movement; every push answered by a counter-push | Align the goals — or stop pushing and redirect effort to where goals already agree |
| Drift to low performance | The goal itself is a stock, eroded by bad news: standards adjust to the latest performance | A slow ratchet downward; each year's "normal" slightly worse | Peg standards to an absolute, or to the best past performance — never to the most recent |
One of the six deserves its own diagram, because it is the structure of half of all technical debt:
Shifting the burden. Two balancing loops compete to relieve the symptom — but the quick fix's side effect starves the fundamental one, so every cycle the top loop gets stronger and the bottom loop weaker.
The tell is dependence: if each application of a fix makes the next application more necessary, you are inside the archetype. Hotfixes versus the refactor. Caffeine versus sleep. Heroic weekends versus staffing the team. The escape is written into the structure — the quick fix is legitimate only as a bridge, and the test of a healthy system is that its use trends toward zero.
🧪 Six Systems Thinking Examples You Already Live In
Thermostat, bathtub, traffic jam, compound interest, team burnout, viral growth — six systems, each carrying one concept from this article, and you are inside all of them already.
Home systems
The shower is the balancing-loop-plus-delay from above: a good controller oscillating on stale information. The bathtub is pure stock logic — and the useful transfer is that every budget, backlog, and inbox is a bathtub: an accumulation governed entirely by the difference between two rates.
Public systems
The traffic jam, from In a World of Systems, is the richest example in either source, because it is two systems stacked on the same road. The mechanical system is a stock with a blocked outflow: cars keep entering from the back while an accident blocks the front, so the stock grows. Then a second system forms on top: "Now that no one is moving, a social system has been added to the traffic system" — frustration escalating through a loop that "gains strength at each cycle."
The intervention is the best moment in the piece. The jam does not clear because anyone drives differently. A road sign lights up with details about the delay — and the anger loop loses its fuel. No lane was added. No car moved. An information link was added where there was none, and a reinforcing loop died of starvation. Adding information is often cheaper and stronger than adding capacity; file that next to every dashboard you have ever built.
Two systems, one road. The green node is the entire intervention — an information flow, leverage point #6.
Compound interest is the reinforcing loop from earlier, running on a constant rate — the reason "small and consistent" beats "large and occasional" in any domain where the output feeds the input.
Work systems
The team burnout loop is reinforcing: deadline pressure → overtime → fatigue → errors → rework → more pressure. Adding people mid-loop often feeds it (onboarding is rework too). The structural fixes attack links: cut scope (weaken the gain), or add slack (open the loop).
Viral product growth is the S-curve machine with a drain: users send invites, invites convert, new users send more invites — while churn quietly empties the same stock. A "growth problem" can therefore be an outflow problem wearing an inflow costume, which is why the first diagnostic question is always which rate actually moved?
The loop everyone draws, plus the outflow almost everyone forgets to draw.
| Example | Stock | Dominant loop | Delay? | Behavior signature |
|---|---|---|---|---|
| Shower | Water temperature at your skin | Balancing | Yes — pipes | Oscillation |
| Bathtub | Water level | Neither — open valves | No | Ramp up or down |
| Traffic jam | Cars in the jam | Reinforcing (social layer) | Yes — no info | Escalation until information arrives |
| Compound interest | Balance | Reinforcing | No | Exponential |
| Team burnout | Unresolved rework | Reinforcing | Yes — fatigue lags | Slow spiral, sudden break |
| Viral growth | Active users | R early, B late | Yes — onboarding | S-curve with churn ceiling |
Your own workspace runs the same picture — a system with state, inputs, and outputs whether or not anyone drew the diagram.
🎛️ Leverage Points: Where to Intervene in a System
Meadows ranked twelve places to intervene in a system, and the ranking is the famous part: parameters — the thing most policy and most product debate argues about — are the weakest lever. Paradigms are the strongest.
The flip-chart origin story
The list was born in real time. Meadows was sitting in a meeting about the emerging global trade regime — NAFTA, GATT, the World Trade Organization — and, in her own telling from Whole Earth (Winter 1997): "The more I listened, the more I began to simmer inside. 'This is a HUGE NEW SYSTEM people are inventing!' I said to myself... Suddenly, without quite knowing what was happening, I got up, marched to the flip chart, tossed over a clean page, and wrote: 'Places to Intervene in a System,' followed by nine items." The nine became twelve in her 1999 Sustainability Institute paper — the canonical version, hosted at donellameadows.org.
Her definition: leverage points are "places within a complex system (a corporation, an economy, a living body, a city, an ecosystem) where a small shift in one thing can produce big changes in everything."
The twelve, weakest to strongest
| # | Leverage point | Plain English | A modern example |
|---|---|---|---|
| 12 | Constants, parameters, numbers | Tweak the dials | Adjusting a budget, a quota, a price |
| 11 | Buffer sizes | Room to absorb shocks | Cash reserves; queue capacity |
| 10 | Stock-and-flow structure | The plumbing itself | Re-architecting a pipeline |
| 9 | Delay lengths | How fast effects arrive | Shorter release cycles |
| 8 | Balancing-loop strength | How hard correction pulls | Stricter review gates, better tests |
| 7 | Reinforcing-loop gain | How fast compounding compounds | Damping a runaway (backoff, caps) |
| 6 | Information flows | Who can see what, when | The traffic sign; observability |
| 5 | Rules | Incentives, constraints | Pricing structure; WIP limits |
| 4 | Self-organization | The power to change structure | Teams that redesign their own process |
| 3 | Goals | What the system optimizes | Optimizing retention vs. signups |
| 2 | Paradigms | The mindset the system arises from | "The workspace is the computer" |
| 1 | Transcending paradigms | Holding all paradigms lightly | — |
Her contempt for the bottom of the list was cheerful and quotable: "Numbers are last on my list of leverage points. Diddling with details, arranging the deck chairs on the Titanic." And the top of the list is where her deepest passage lives, from chapter four of Thinking in Systems:
"Everything we think we know about the world is a model. Every word and every language is a model. All maps and statistics, books and databases, equations and computer programs are models. So are the ways I picture the world in my head — my mental models. None of these is or ever will be the real world."
The practical reading of the ranking, for anyone who builds things: before touching a parameter, ask whether there is an information flow you could add instead (the traffic sign), a rule you could change, or a goal that is silently wrong. It is the difference between running a company on well-placed loops and running it on effort — the same leverage logic behind treating execution itself as the layer that compounds. And when you want to find a system's paradigm, the fastest route is the Feynman move: rebuild the model from scratch and see what assumption you cannot avoid writing down.
🤖 Agent Loops Are Feedback Loops: Systems Thinking for the AI Era
Every AI agent runs Meadows' ultimate feedback loop under new names: perceive is the dashed information link, reason is the decision rule, act is the rate, and the environment it acts on is the state. Add memory, and the agent has a stock that compounds.
This mapping is not a metaphor — it is the same diagram with the labels swapped. Compare the loop below to the first diagram in this article, drawn 48 years apart:
The perceive-reason-act loop is a balancing loop: state sensed through an information link, compared to a goal, acted on. Memory adds a reinforcing loop on knowledge.
The mapping earns its keep in the failure modes — each classic agent failure is a classic loop failure:
| Agent-loop stage | Systems-thinking element | Failure mode when it breaks |
|---|---|---|
| Perceive | The dashed information link | Stale or missing context; deciding open-loop |
| Reason | The decision rule | Optimizing an unnamed or wrong goal |
| Act | The rate | Actuator errors — visible, and usually the cheap kind |
| Memory | A stock | No outflow: context bloat, unbounded accumulation |
| Goal | The goal | Goal-seeking the wrong target very efficiently |
Two structural notes complete the picture. First, an agent whose memory accumulates across sessions is a reinforcing loop on knowledge — every answer becomes context that improves the next answer, which is what makes a second brain compound rather than merely store. Second, the newest model generation closes loops on itself: reasoning models iterate on their own output at inference time, and reflection-based agents run a learning loop over their own past attempts. The vocabulary of this article — loop gain, delay, goal, dominance — is the natural language for all of it. The agent loop even carries the name.
🧠 The Structure Finally Arrived: What a Complete Brain Map Showed
Systems thinking has always had one uncomfortable gap. "Structure generates behavior" is the field's core claim, but for most real systems nobody can see the structure. You infer it from behavior and argue about the diagram.
In 2026 that gap closed for one system. A female fruit fly map arrived in June, and in September researchers published the first complete wiring diagram of a male fruit fly's central nervous system: 166,700 neurons and roughly 125 million connections, brain and nerve cord together. Every node, every edge, every direction. The structure, on the table, for a system that demonstrably produces sophisticated behavior.
Two findings matter for anyone who draws causal loop diagrams.
First: the loops are local, and the hierarchy supervises rather than commands. The companion whole-CNS paper found that motor, endocrine and visceral effectors are driven mainly by sensory neurons in the same body part, forming local feedback loops. Ascending and descending neurons join those loops into behavior-centric modules, and higher brain regions supervise the modules. The authors call it "distributed, parallelized and embodied." That is a system built almost entirely from balancing loops running in parallel, with selection rather than command at the top — closer to the murmuration at the start of this article than to a thermostat wired to a furnace.
Second, and more sobering: a complete structure map still does not predict behavior. This is the part every systems thinker should sit with. A 2024 Nature paper introduced the term "effectome" for the missing half, and stated the limit exactly:
A wiring diagram "specifies the synaptic paths by which neurons can affect each other, but not how strongly they do affect each other in vivo."
Read that against the causal-loop-diagram section above. An arrow means a path exists. It does not carry a strength. Neuroscience arrived at the same conclusion from the opposite direction — with a perfect, complete, exhaustively verified diagram in hand — and concluded that recovering strengths requires perturbation, not a better map.
That is the sharpest available argument for a discipline this article already recommends: draw the loops to locate the candidates, then go change something and measure what happens. The diagram narrows the search. Only the experiment settles it.
Full treatment in the complete connectome explained, including why "largest brain map" needs a qualifier and what forty years of connectomics actually produced.
🚨 Retry Storms: When Production Systems Loop on Themselves
Engineering rediscovered Meadows under incident pressure. Google's SRE book opens its cascading-failures chapter with a definition she could have written: "A cascading failure is a failure that grows over time as a result of positive feedback."
The mechanics are a textbook reinforcing loop. A service slows down; requests time out; clients retry; the retries add load; the added load slows the service further. The SRE book walks the arithmetic of 100 queries per second of failures becoming 200, then 300, as retry layers stack. AWS's Marc Brooker states the loop's character exactly: "Retries are 'selfish'... when failures are caused by overload, retries that increase load can make matters significantly worse."
A retry storm. The corrective action — retrying — feeds the reinforcing loop. The green nodes are loop surgery.
Read the standard fixes as what they structurally are, and the whole SRE playbook turns out to be applied Meadows:
| SRE practice | Systems-thinking reading |
|---|---|
| Retry storm | Corrective action feeding a reinforcing loop |
| Exponential backoff | Reducing the loop's gain |
| Jitter | Desynchronizing correlated oscillators |
| Circuit breaker | Opening the loop entirely |
| Load shedding | A balancing loop with an explicit goal |
| Observability | Repairing the dashed information line |
The deepest lesson transfers everywhere: the retry was supposed to be the fix. A corrective action that touches something upstream of the condition that triggered it is not a correction — it is fuel. Asking that one question of every automatic remedy, human or machine, is systems thinking earning its keep.
📦 Systems Thinking for Product Teams
Product problems usually present as events — a bad week, a missed number. Systems thinking re-presents them as behavior signatures you can read straight off a chart, using the diagnostic table from earlier.
| Situation | Behavior signature | Structural read | Highest-leverage move |
|---|---|---|---|
| Activation flat despite shipping features | Stagnation under effort | A balancing loop with an unnamed goal (e.g., onboarding friction resets every gain) | Name the goal the system is actually seeking |
| Growth stalled, acquisition unchanged | Stock in dynamic equilibrium | Churn outflow quietly matching the inflow | Fix the drain, not the faucet |
| WIP ballooning, throughput flat | Stock with blocked outflow | Completion rate, not intake, is the constraint | WIP limits — a rule, leverage #5 |
| Roadmap driven by loudest request | Open-loop decisions | No dashed line back from real usage | Add the information flow — leverage #6 |
| Metrics reviewed monthly, shipped daily | Oscillation risk | Correction delay ≫ action delay | Shorten the review loop |
One cadence note, because it is delay-surgery on your own process: the gap between shipping and learning what shipping did is the delay inside your team's balancing loop. Everything that shortens it — deployment-frequency and feedback metrics, weekly reviews, live dashboards — damps oscillation for free. A founder operating system is, structurally, just this table with owners attached.
🛠️ Where Loops Become Software: Running Systems in Taskade
Everything in this article can stay a diagram — or it can run. This is the part where the loop vocabulary maps onto things you can actually build in Taskade:
- An automation is a balancing loop with an explicit goal: a trigger senses state, a condition compares it to the goal, an action changes it. Trigger → condition → action is dashed-line, gap, rate.
- An AI agent runs the perceive-reason-act loop from the diagram above against your real workspace — reading state, comparing to the goal you gave it, and acting.
- The workspace itself accumulates: projects and docs are stocks, task completions and automation runs are flows, and knowledge that compounds is the reinforcing loop that makes the whole thing more useful over time.
- If you have drawn a loop while reading — a burnout loop, a growth loop, a review cadence — you can describe it in a sentence and Taskade Genesis will build a working app around it: the stock as a database, the rates as automations, the dashboard as your dashed line. Or start from a live app someone else already wired.
The honest version of the pitch is structural: software is the one medium where you can draw a feedback loop and then switch it on.
🧯 What Meadows Never Said: Misattributions and Myths
The most-quoted "Meadows facts" include several that fail verification. Here are the receipts — partly for accuracy, partly because checking quotes against structure-generating sources is systems thinking applied to itself.
| The claim | The reality |
|---|---|
| "The purpose of a system is what it does" — Meadows | Stafford Beer, the British cybernetician — the POSIWID principle. Not a Meadows line. |
| The Limits to Growth predicted collapse by 2000 | The 1972 conclusion: limits would be reached "sometime within the next one hundred years." Turner's 2008 CSIRO retrospective states the MIT team "did not predict world collapse by the end of the 20th Century." |
| "The models were disproven" | Turner (2008) found 1970–2000 data "compares favorably" with the standard-run scenario; Herrington's 2020 update in the Journal of Industrial Ecology found the closest-fit scenarios were BAU2 and CT — a tracking result, not a prophecy, in either direction. |
| "Sold 30 million copies" | The Club of Rome's own 50th-anniversary history: "well over 3 million copies in 35 languages." |
| Meadows was a Pulitzer finalist | Her column The Global Citizen was nominated in 1991; she does not appear in the Pulitzer finalist database. |
| Thinking in Systems was written in 2008 | Completed in 1993, circulated informally for 15 years, published posthumously in 2008, edited by Diana Wright. |
| "Structure generates behavior" (in quotes) | A fair paraphrase, but not verbatim. The book's actual line: "System structure is the source of system behavior." |
None of these corrections diminish the work. The strongest claims — the loop taxonomy, the stock-flow grammar, the leverage hierarchy — survive scrutiny completely intact, which is precisely why the fabricated garnish is unnecessary.
🧭 Quo Vadis? Systems Thinking in 2026
Meadows died in February 2001, at 59, after 29 years of teaching. The curriculum she taught has had an unusual afterlife: Peter Senge's The Fifth Discipline (1990) carried it into business as the discipline that integrates all the others; the World Economic Forum's Future of Jobs Report 2025 now ranks systems thinking #12 among core skills and #11 among the fastest-rising skills through 2030, in the same cluster as AI literacy and autonomous-systems skills.
And the relevance argument has inverted. In 1977 the lecture asked you to imagine systems governed by feedback. In 2026 the software running your workday — agents sensing state and acting toward goals, automations correcting drift, emergent behavior from coupled loops nobody designed — is the diagram. Forrester's assertion, which Meadows relayed as a challenge she could not defeat, has only gotten harder to refute: "no human decision is ever made outside the context of a feedback loop." She added: "I must say I haven't found one yet, but think about it."
The behavior you are staring at right now — a flat curve, an oscillating metric, a runaway cost — is evidence about structure. Draw one loop today: name the stock, the two rates, the goal, the delay, and the dashed line. That single sketch is the entire method, and it is one sentence away from running.
▲ ■ ● Structure generates behavior. Information beats capacity. Paradigms beat parameters. Memory feeds Intelligence, Intelligence triggers Execution — that is a reinforcing loop, and it is the one you want on your side.
🔗 Related Reading
Loops in the machine
- What Are AI Agents? — the perceive-reason-act-learn loop, in product form
- The History of AI Agents — sixty years converging on one loop
- AI Agent Reliability — balancing loops in production: generator, checker, gate
- AI Reasoning Models Explained — models that loop on their own output
- Reduce LLM Costs — a reinforcing cost loop outrunning falling prices
Thinking tools
- Hierarchical Thinking — the decomposition move systems thinking complements
- The Feynman Technique — rebuild the model to find its paradigm
- AI Second Brain — a knowledge stock that compounds
- AI World Models Explained — machines building internal models of systems
- How AI Data Centers Work — the physical stocks and flows behind every token
Systems that run your work
- Agentic Workspaces — the loop that closes itself between sessions
- The Workspace DNA Graph — why the loop compounds
- The Founder Operating System — a company that runs on loops
- One-Person Companies — leverage points in practice
🐑 Before you go
- 🔁 Build a real balancing loop — Automations
- 🤖 Put a perceive-reason-act loop to work — AI Agents
- 🧬 Turn a loop sketch into a working app — Taskade Genesis
- 🌍 Clone a system someone else already wired — Community
🔗 Resources
- Donella Meadows, "A Philosophical Look at System Dynamics" (Dartmouth College, 1977) — youtube.com/watch?v=XL_lOoomRTA
- In a World of Systems (The Donella Meadows Project, 2016), David Macaulay & Linda Booth Sweeney — youtube.com/watch?v=A_BtS008J0k
- Donella Meadows, "Leverage Points: Places to Intervene in a System" (Sustainability Institute, 1999) — donellameadows.org
- Donella Meadows, Thinking in Systems: A Primer (Chelsea Green, 2008), ed. Diana Wright
- Donella Meadows, "Places to Intervene in a System," Whole Earth, Winter 1997
- Club of Rome, The Limits to Growth: A Short History of a Ground-Breaking Publication (February 2022) — clubofrome.org
- Graham Turner, "A Comparison of The Limits to Growth with 30 Years of Reality" (CSIRO Working Paper, 2008; Global Environmental Change 18:397–411)
- Gaya Herrington, "Update to Limits to Growth," Journal of Industrial Ecology (2020) — DOI 10.1111/jiec.13084
- Google, Site Reliability Engineering, ch. 22, "Addressing Cascading Failures" (O'Reilly, 2016) — sre.google
- Marc Brooker, "Timeouts, Retries, and Backoff with Jitter," AWS Builders' Library (2019) — aws.amazon.com/builders-library
- World Economic Forum, Future of Jobs Report 2025 (January 2025) — weforum.org
- MIT News, "Jay Forrester, professor emeritus and digital computing and system dynamics pioneer, dies at 98" (November 2016) — news.mit.edu
- System Dynamics Society, The Beer Game — systemdynamics.org/beer-game
Featured image: starling murmuration by Skander zarrad, Wikimedia Commons, CC BY-SA 4.0.
💬 Frequently Asked Questions About Systems Thinking
How do I start learning systems thinking?
Start by drawing one loop from your own life: name a stock (something that accumulates), its two rates (what fills it, what drains it), the goal, and the information you read to decide. Then read Thinking in Systems — it is short, and the first chapter's bathtub covers half the discipline. The 1977 lecture and the 2016 animation in the resources above are both free.
How is systems thinking different from design thinking?
Design thinking is a process for inventing solutions — empathize, define, ideate, prototype, test. Systems thinking is a lens for understanding why current behavior persists — stocks, loops, delays. They compose well: systems thinking tells you where the leverage is, and design thinking helps you build the intervention.
How is systems thinking different from critical or analytical thinking?
Analytical thinking decomposes: it isolates parts and studies them separately, which works when the parts are independent. Systems thinking does the opposite move — it studies the interactions, because in tightly coupled systems the behavior comes from the loops between parts, not from any part alone.
Can I use systems thinking for personal productivity?
Directly. Your task list is a stock with an intake rate and a completion rate — if it grows forever, that is a rates problem, not a willpower problem. A habit is a reinforcing loop on a small constant rate. And the delay between doing work and seeing results is why motivation oscillates: you are a balancing loop acting on lagged information.
How do I know which loop is dominant in my system?
Read the behavior. Exponential movement means a reinforcing loop currently dominates; approach toward a ceiling or floor means a balancing loop does. When a curve changes character — growth rolling over into a plateau — dominance has shifted, usually because a nonlinear relationship steepened as a stock filled or drained.
Where should I draw the boundary of a system model?
Around the behavior you are trying to explain — and no wider. Meadows' rule was that the problem is not where to start but where to stop: loops always continue past the edge of any diagram. If the behavior you care about can be produced by the loops inside your boundary, the boundary is good enough.
What software can I use to draw causal loop diagrams?
Anything that draws boxes and arrows works — the notation is deliberately whiteboard-simple. The diagrams in this article are written as Mermaid text and rendered live, which keeps them versionable next to the decisions they document. For a running system rather than a picture of one, a workspace with automations lets the loop actually execute.
How do AI agents use feedback loops?
An agent's perceive-reason-act cycle is a balancing loop: it senses the state of its environment through an information link, compares it against the goal you gave it, and acts to close the gap. Agents with persistent memory add a reinforcing loop — each completed task improves the context available to the next one.
What is the difference between open-loop and closed-loop decisions?
A closed-loop decision reads the state it is about to change; an open-loop decision does not. Open-loop is not automatically wrong — a one-shot action with a known outcome needs no sensor — but any repeated decision made without reading its own consequences will drift, because nothing in its structure corrects it.
What is a positive vs negative feedback loop?
Positive and negative feedback are the physics and biology names for what this article calls reinforcing and balancing loops. Positive feedback amplifies change — compound interest and the retry storm are both positive feedback — and negative feedback counteracts it, like the thermostat. The systems vocabulary exists because the everyday senses mislead: a positive feedback loop is not good news (Google defines a cascading failure by it), and a negative loop is usually the one keeping you alive.
What is the iceberg model in systems thinking?
A four-layer diagnostic: events at the surface, patterns of behavior beneath them, systemic structures beneath those, and mental models at the bottom. Each layer down explains the one above and offers more leverage — reacting to events is the weakest response, redesigning structures and questioning mental models the strongest. The metaphor traces to Edward T. Hall's 1976 cultural iceberg and was adapted for systems work in the Fifth Discipline community; the full section above maps each layer onto Meadows' vocabulary.
What are system archetypes?
Recurring loop structures that produce the same characteristic failure wherever they appear — tragedy of the commons, shifting the burden, escalation, success to the successful, policy resistance, drift to low performance. Meadows called them traps, and the framing matters: because each trap is a structure rather than a moral failing, each has a known structural escape, listed in the archetypes table above.
What is the bullwhip effect?
The amplification of small demand changes as orders travel up a supply chain: a one-case blip at the retailer becomes boom-and-bust at the factory, because each tier orders against delayed, secondhand information. The Beer Game — a four-tier simulation from MIT Sloan's system dynamics group — demonstrates it reliably even with expert players. The fix is structural: share point-of-sale data across tiers, an information-flow intervention rather than a forecasting one.
Where can I see feedback loops running in a real workspace?
The Taskade community gallery is full of working examples — apps where a database is the stock, automations are the rates, and an agent closes the loop. Clone one and you can inspect the whole structure, then describe your own loop and have Taskade Genesis build it.