


You can automate roughly 99% of your reporting and dashboards with AI in 2026 — and the 1% you keep is the part that actually needs you: deciding what a surprising number means and what the team should do about it. Modern AI reporting systems now pull the data, format it, refresh the charts, and write the commentary that explains what changed and why — all on a schedule, without anyone copying numbers between tools. Teams that make this shift reclaim the 8-12 hours a week they used to spend assembling status updates by hand. The fastest way to get there is to stop building dashboards manually and instead describe the report you want — then let it rebuild itself every cycle.
TL;DR: Reporting in 2026 is no longer a weekly copy-paste chore — it is a living system that pulls data, refreshes dashboards, and writes AI commentary on a schedule. Teams reclaim 8-12 hours a week by letting reports build themselves. The fastest path: describe the outcome and let Taskade Genesis build the data pulls, agents, and live dashboard. Clone the working reporting app below →
This is not a gallery of pretty charts. If you want inspiration for what to build, read our AI dashboard examples guide — that one shows you what dashboards look like. And if you are estimating project timelines, our AI project estimation tools guide covers forecasting effort. This guide is different. It shows you how to build the reporting operating system — the data pulls, the agents that write commentary, the schedule, and the connected dashboard that keep your reports current while you sleep. By the end you will know exactly what to automate first, which agents to build, and how to wire them into one living workspace.
See it live — clone a working reporting app
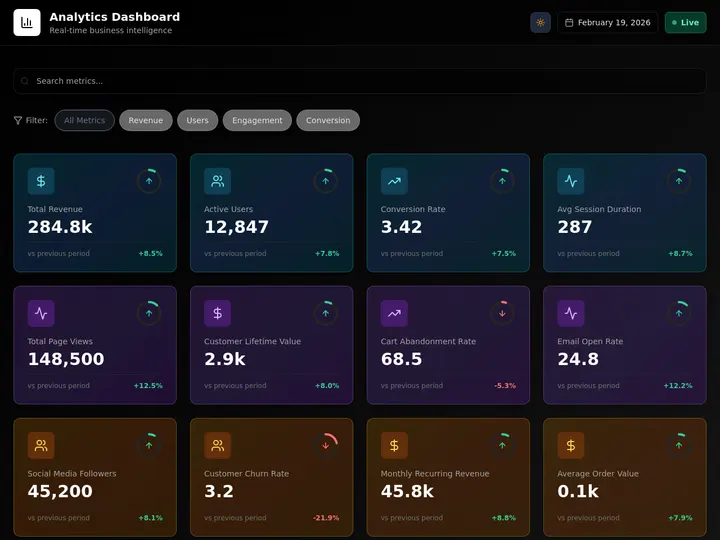
You do not have to imagine this. The reporting app below was built from a single prompt and runs in your browser right now. Clone it in about 30 seconds and it lands in your own workspace, ready to connect to your data sources.
That is the whole point of automated reporting: the output is not a static chart, it is software that refreshes itself. You describe the report, and you get a real app with a database, AI agents that write commentary, and automations that run on a schedule — no dashboard to wire, no BI seat to buy. Browse more cloneable dashboard apps or start your own from a prompt.
What does it mean to automate reporting with AI?
Automating reporting with AI means handing each recurring report to software that assembles and explains itself instead of waiting for a person to copy numbers between tools. A modern reporting system pulls the data from your sources, validates it, refreshes the charts, compares this period to the last, and drafts a plain-language explanation of what moved — all on a schedule. Teams that adopt this pattern reclaim 8-12 hours a week per person who used to build status reports by hand. That is the line between old dashboards and 2026 reporting: an old dashboard draws a chart and waits; an AI reporting system delivers the finished story.
Here is the difference in one picture. A classic dashboard is a window onto data. An AI reporting system is a loop that pulls, explains, and ships.
The old loop repeats forever and gets slower as your data grows. The new loop runs while you sleep and gets smarter as the agents learn your metrics. That second loop is what Taskade Genesis builds for you from a single prompt — the AI agents, the automations, and the dashboard, all in one connected app.
What can you actually automate in reporting?
You can automate the entire reporting pipeline except the final judgment call — roughly 99% of the work. The pipeline breaks into five stages, and a person only needs to touch the last one. Everything before "decide what to do" is repeatable, and repeatable work is exactly what AI systems do well.
Here is the full pipeline and who owns each stage:
| Stage | What happens | Who owns it |
|---|---|---|
| 1. Pull | Fetch fresh numbers from CRM, sheets, project tools, analytics | Automation (scheduled) |
| 2. Validate | Check for gaps, dedupe, flag anomalies | Data agent |
| 3. Refresh | Rebuild charts, tables, scorecards | Dashboard app |
| 4. Explain | Compare to last period, draft what-changed commentary | Commentary agent |
| 5. Decide | Read the story, choose the next action | You (the 1%) |
Notice that four of the five stages run with zero human input. The data pulls happen on a schedule, the agents validate and explain, and the dashboard refreshes itself. You arrive to a finished report and spend your time on the decision, not the assembly.
The reports worth automating first
Not every report deserves the same priority. Start with the ones you build most often and that require the least judgment to assemble. Here is the ranking most teams use:
| Report type | Frequency | Hours saved/cycle | Automate first? |
|---|---|---|---|
| Weekly status report | Weekly | 2-3 | Yes — highest ROI |
| KPI scorecard | Daily/weekly | 1-2 | Yes |
| Project health dashboard | Continuous | 3-4 | Yes |
| Pipeline / revenue summary | Weekly | 2-3 | Yes |
| Monthly business review | Monthly | 6-8 | After weeklies work |
| Executive one-pager | Monthly | 2-3 | After MBR works |
The weekly status report is almost always the best first target. It is high-frequency, low-judgment, and the format barely changes — exactly the profile of a job that should build itself. Once your weekly report runs untouched for a month, layer the monthly business review on top of the same data.
How does AI write commentary that explains what changed?
AI commentary works by comparing the current period to the previous one, finding the largest movements, and drafting a plain-language explanation of what moved and the likely cause. Instead of telling you "pipeline is $1.2M," a commentary agent tells you "pipeline dropped 14% this week because two enterprise deals slipped to next month — the rest of the funnel held steady." That narrative is the part of reporting that used to require a human to sit and think. Now it arrives as a first draft.
The reliable way to build it is a multi-agent team, where each agent owns one job and a human approves the final read:
Each agent in Taskade Genesis ships with 33 built-in tools — web search, file analysis, code execution, and more — and routes across 15+ frontier models from OpenAI, Anthropic, and Google so the commentary uses the right model for the job. Agents also carry persistent memory, which is why the narrative reads like your team wrote it: the agent remembers your targets, your metric names, and how you talk about wins and misses.
Citation capsule: A reporting agent that compares period-over-period and drafts the cause of each major movement turns a two-hour weekly write-up into a five-minute review. The human stays on the judgment — what the change means and what to do about it — while the agent owns the assembly and the first-draft narrative. This is the difference between a dashboard that shows numbers and a reporting system that explains them.
A worked example: the weekly pipeline report
Concrete beats abstract. Say you run a sales pipeline report every Monday. Here is what the same report looks like before and after you hand it to a reporting agent — the work does not disappear, it moves off your plate.
| Step | Manual Monday (the old way) | Automated Monday (the new way) |
|---|---|---|
| 6:00am | Nothing — you are asleep | Schedule fires, data agent pulls the CRM |
| 8:30am | Open CRM, export to a sheet | Charts already refreshed, deltas computed |
| 9:00am | Copy numbers, fix formatting | Commentary agent has drafted the narrative |
| 9:45am | Write "what changed" by hand | Reviewer agent has flagged the two slipped deals |
| 10:00am | Send the report, hope it is right | You read a 5-minute draft and approve |
| Total | ~2 hours, every week | ~5 minutes, every week |
The finished commentary reads like a teammate wrote it: "Pipeline closed the week at $1.03M, down 14% from last Monday's $1.20M. Two enterprise deals (Acme, Northwind) slipped to next month after legal review; the mid-market funnel actually grew 6%. No action needed on velocity — the slip is timing, not health." That is a commentary agent comparing periods, finding the largest movements, and naming the likely cause. You spend your Monday deciding what to do about Acme and Northwind, not assembling the slide.

How do you build a self-updating dashboard, step by step?
You build a self-updating dashboard by describing the report once, connecting your data sources, and setting a schedule — then it rebuilds itself every cycle. There is no canvas to wire and no query language to learn. The whole flow is five steps, and four of them are one-time setup. Here it is as a decision tree you can follow:
┌─────────────────────────────────────────────────────────────┐
│  BUILD A SELF-UPDATING REPORTING APP (one prompt → live app) │
└─────────────────────────────────────────────────────────────┘
        │
        ▼
  ┌───────────────┐   "Build a weekly project status
  │ 1. DESCRIBE   │    dashboard with health, blockers,
  │    the report │    and a what-changed summary."
  └──────┬────────┘
         │
         ▼
  ┌───────────────┐   Genesis ships a real app:
  │ 2. GET AN APP │   database + 7 views + agents
  └──────┬────────┘   + automation skeleton
         │
         ▼
  ┌───────────────┐   Pull from CRM, sheets, project
  │ 3. CONNECT    │   tools, analytics — 100+ two-way
  │    your data  │   integrations
  └──────┬────────┘
         │
         ▼
  ┌───────────────┐   Daily? Weekly? Monthly?
  │ 4. SET THE    │   The pull + refresh + commentary
  │    SCHEDULE   │   run on a cron you choose
  └──────┬────────┘
         │
         ▼
  ┌───────────────┐   Share the live link. It refreshes
  │ 5. SHIP IT    │   itself. You review, not rebuild.
  └───────────────┘
Each step maps to a concrete action in Taskade Genesis. Step 1 is a sentence. Step 2 is automatic — Genesis builds the app, the database, and the agents for you. Step 3 uses the 100+ integrations to wire your sources. Step 4 sets the schedule trigger. Step 5 shares a live, cloneable app. Want the walkthrough with screenshots? See Learn Taskade automations and building custom agents.
Choosing the right view for each audience
One of the biggest wins of building reports as a real app is that the same data renders in 7 project views without rebuilding anything. Analysts want a table; leadership wants a dashboard; a project lead wants a Gantt. Same numbers, different lens:
| View | Best for | Audience |
|---|---|---|
| Table | Raw metrics, sortable rows | Analysts |
| Board | Status buckets, kanban health | Project leads |
| Calendar | Reporting cadence, deadlines | Ops |
| Gantt | Timelines and dependencies (includes timeline scrolling) | PMs |
| Mind Map | Drill-down from KPI to driver | Strategy |
| Org Chart | Ownership and accountability | Leadership |
| List | Quick scan of action items | Everyone |
Because all 7 views point at the same database, switching audiences is a click — not a new report. Note that Timeline is part of the Gantt view, not a separate one. This is what we mean by a reporting operating system: one source of truth, seven ways to read it.
How Taskade does it differently
Here is the honest version. Most automation tools — n8n, Lindy, Zapier, Make, and the BI dashboard tools like Looker or Power BI — are genuinely good at what they do. They wire nodes. You drag a trigger, connect it to an action, map the fields, and a pipeline runs. For a single data sync or a one-off chart refresh, that node-wiring model is fast, reliable, and battle-tested. Zapier in particular has a connector library that is hard to beat for breadth, and a Make scenario can express branching logic that is a real strength. If all you need is to move numbers from A to B, those tools shine.
But a report is not a pipeline. A report is a living thing — it has a database, a schedule, charts, narrative, and an audience that asks follow-up questions. Wiring nodes gets you the data movement; it does not get you the app. You still have to build the dashboard somewhere else, write the commentary yourself, and stitch the pieces together. Taskade ships the whole living app from one prompt.
That difference is the Workspace DNA — the self-reinforcing loop that node-wiring tools do not have:
In a node-wiring tool, the trigger fires, the action runs, and the loop ends — nothing learns. In Taskade, every reporting cycle writes results back into the Projects database (Memory), which feeds the AI agents (Intelligence) that write sharper commentary, which fire the Automations (Execution) that pull the next cycle. The report does not just refresh — it compounds.
The four things node-wiring tools structurally cannot ship from a single prompt:
| Capability | Node-wiring tools | Taskade Genesis |
|---|---|---|
| Data movement | Yes — strong connectors | Yes — 100+ two-way integrations |
| A real dashboard app | Build it separately | Ships from the prompt |
| AI commentary | Bolt on an LLM step | Multi-agent team, built in |
| Cloneable / shareable | Export a workflow file | Live /share/apps/* link |
Acknowledging the genuine strength: if your only need is raw connector breadth for data plumbing, a dedicated automation tool may still win on connector count. Taskade's wedge is everything above the plumbing — the app, the agents, the views, and the shareable result. You can clone a working reporting app and have all four in your workspace in under a minute, then connect your own data. That is not a workflow you export; it is software you run.
Taskade Genesis vs the BI and dashboard tools
The 2026 reporting market splits into two camps. Enterprise BI tools — Power BI with Copilot, Tableau Pulse, ThoughtSpot — and AI-native analytics tools — Basedash, Zoho Analytics with Zia — are all genuinely good at turning a connected data warehouse into charts and natural-language summaries. The generative-AI-in-visualization market hit roughly $5.75 billion in 2026 and is growing about 15% a year, so this category is real and well funded. But every one of these tools starts from the same assumption: you already have a modeled data source, and you want a better way to look at it. Taskade Genesis starts one step earlier — you describe the report in plain English and it builds the whole app, database included.
Here is the honest, head-to-head version. Each competitor is strong at something; the wedge is what they cannot ship from a single prompt.
| Capability | Power BI Copilot | Tableau Pulse | ThoughtSpot | Zoho Analytics (Zia) | Taskade Genesis |
|---|---|---|---|---|---|
| Build from one prompt | Report draft only | Metric definition | Search-to-answer | Dashboard from prompt | Full app: DB + agents + automations |
| Ships a database | No — connect a model | No — connect a source | No — connect a source | Partial | Yes — born with the app |
| AI commentary / narrative | Yes (Copilot) | Yes (anomaly + summary) | Yes (Spotter) | Yes (Zia) | Yes — multi-agent team |
| Runs automations end to end | Via Power Automate (extra) | No | No | Scheduled refresh | Yes — 100+ two-way, built in |
| Cloneable / shareable app | Workspace export | Cloud link | Liveboard link | Shared view | Live /share/apps/* clone |
| Entry cost | Premium F64 capacity | Tableau Cloud seat | Quote-based | Per-user tiers | Free, then $6/mo annual |
Read the table honestly. Tableau Pulse is excellent at anomaly detection on a defined metric and ships its narrative summaries at no extra license cost on Tableau Cloud — if your metrics are already modeled, that is a clean experience. ThoughtSpot has a genuinely best-in-class search-first interface; typing a question and getting a live chart is its whole identity and it does it well. Power BI Copilot is the deepest if your company already lives in Microsoft Fabric. Zoho Analytics with its Zia agent builds a dashboard from a single prompt and is friendly to small teams.
Where they all stop is the same place: they are lenses on data you already shaped, not systems that build the report end to end. Power BI Copilot famously requires a Premium F64-class capacity before Copilot turns on — a real cost floor. None of them ship a database with the report, run the multi-step automation that pulls the data, or hand you a cloneable living app. That gap is exactly the wedge.
Citation capsule: Teams that deploy AI-powered analytics for non-technical staff have reported roughly $4.73 in return per dollar spent, versus about $2.41 for traditional BI — a near-2x improvement driven mostly by removing the dependency on a data engineer to build and maintain each report. Taskade Genesis pushes that further by collapsing the dashboard tool, the scheduler, and the reporting service into one app you describe once. The cheapest report is the one that builds itself. Pick the tool that matches your stack — if you want the app and not just the chart, start from a prompt.
When a BI tool is the right call, it is the right call — if your data already lives in a warehouse and your only job is visualization, a dedicated BI seat may be the cleaner fit. Taskade's wedge is the team that does not have a data engineer, a modeled warehouse, or a BI budget, and just needs the weekly report to build and explain itself. See the full landscape in our AI dashboard builders roundup and AI dashboard examples you can clone.
What does an automated reporting workflow look like end to end?
An end-to-end automated reporting workflow runs in four phases — pull, build, explain, distribute — and a person only enters at the approval gate before distribution. The entire flow executes on a schedule you set, and the reporting agents handle every step in between. Here is the complete loop as it runs each cycle:
The only human touch is the approval gate — the 1%. Everything else runs on the automation schedule. The data agent refuses to ship incomplete numbers, the commentary agent drafts the narrative, and the reviewer agent catches anomalies before they reach leadership. By the time you open the report, the work is done and the question waiting for you is "what do we do about this," not "what are the numbers."
The reporting cadence at a glance
Different reports want different schedules. Here is how the cadence usually breaks down once the system is running, so you can decide what to set:
| Report | Schedule | AI commentary | Human review |
|---|---|---|---|
| KPI scorecard | Daily 6am | Movement flags only | Skim |
| Weekly status | Mon 6am | Full what-changed | 5-min read |
| Pipeline summary | Mon + Thu | Deal-level deltas | 5-min read |
| Monthly business review | 1st of month | Full narrative + trends | 30-min read |
The pattern is that daily reports get light commentary and a skim, while monthly reviews get full narrative and a real read. The system adapts the depth of the AI commentary to the cadence, so you are never over- or under-served. Set it once in Taskade automations and it holds.
How do AI reports connect to your existing data?
AI reports connect through 100+ bidirectional integrations — triggers pull data in from your project tools, CRM, spreadsheets, forms, and analytics, and actions push the finished report back out to email, chat, or a shared doc. The word "bidirectional" matters: the same connection that reads your latest numbers also publishes the dashboard link, so the loop never breaks at a tool boundary. One integration, both directions.
Here is the connection map for a typical reporting setup:
The reporting database sits in the middle, the agents read it, and the finished report flows out to wherever your team already looks. Because every connection is two-way, you never have to maintain a separate "publish" pipeline — see Learn Taskade connectors for how each integration handles both directions. Set up the data pulls in the automation builder and the agents in the agent builder.
Who controls who sees each report?
Reporting controls access through 7-tier role-based permissions — from Owner down to Viewer — so leadership sees the executive summary, analysts edit the underlying data, and external stakeholders get a read-only link. This matters because reports often mix sensitive numbers with public-facing summaries, and you want the right people on each layer. Taskade never uses an "Admin" role; the tiers run Owner, Maintainer, Editor, Commenter, Collaborator, Participant, and Viewer.
| Role | Can do | Typical use |
|---|---|---|
| Owner | Everything, including delete | Report builder |
| Maintainer | Manage members + structure | Ops lead |
| Editor | Edit data + commentary | Analyst |
| Commenter | Comment, not edit | Reviewer |
| Viewer | Read-only access | Stakeholder |
You set permissions per project, so a single workspace can hold an internal pipeline report (Editors only) and a public KPI dashboard (Viewers welcome) side by side. Learn more in Learn Taskade project sharing and the community gallery of shared apps.
What can Taskade Genesis actually do for reporting?
Taskade Genesis is not a reporting feature bolted onto a notes app — it is a full workspace platform where every piece of the reporting loop has a home. The reason reporting works so well here is that the same primitives that build the report also build the rest of your operating system. Here is the whole platform, mapped to the reporting job each part does.
| Capability | What it is | What it does for your reports |
|---|---|---|
| Workspace DNA loop | Memory + Intelligence + Execution, self-reinforcing | Each cycle writes results back, so reports compound |
| 33 built-in agent tools | Web search, file analysis, code execution, custom slash commands, memory | Agents pull, validate, and explain without you wiring anything |
| 7 project views | List, Board, Calendar, Table, Mind Map, Gantt, Org Chart | One dataset renders for analysts, PMs, and leadership |
| Multi-agent teams | Data, commentary, and reviewer agents working together | A report assembled and checked before you read it |
| 100+ bidirectional integrations | Triggers pull in, actions push out | Numbers flow in from your stack, the report flows back out |
| Custom domains + app publishing | Ship a Genesis app on your own URL | A branded, shareable dashboard for stakeholders |
| 15+ frontier models | OpenAI, Anthropic, Google, and open-weight providers | The right model writes each piece of commentary |
The piece most reporting tools miss is the Workspace DNA loop — Memory, Intelligence, and Execution reinforcing each other instead of running once and stopping. In reporting terms: your Projects database is the Memory that holds every period's numbers; your AI agents are the Intelligence that reads that memory and writes sharper commentary each cycle; your Automations are the Execution that pulls the next batch of data on schedule. Every cycle feeds the next, so a report you build in week one is smarter by month three.
The practical upshot: you do not buy a dashboard tool, then a scheduler, then a reporting service, then glue them together. You describe the report and Taskade Genesis builds the database, the multi-agent team, the scheduled automations, and the live dashboard as one connected app — then lets you publish it on a custom domain and share a cloneable link. Across all 15+ frontier models, the commentary agent picks the right model for the narrative and the data agent picks the right one for validation, so quality stays high without you choosing models by hand.
Where this is heading
The direction is clear: every team will run on a self-reinforcing Memory + Intelligence + Execution loop, and the gap between "I need a report" and "the report exists and explains itself" collapses to a single sentence. Reporting is the first domain where this lands cleanly because it is repetitive, data-driven, and high-value — but it is the leading edge, not the whole story. The same loop that builds a weekly status dashboard builds your accounting close, your operations reviews, and your project tracking from the same workspace. One prompt becomes a living app; that app learns your numbers; and over time the workspace itself becomes the system of record that runs the business. That is Taskade's vision — not better charts, but a workspace that thinks, remembers, and acts on its own.
What should you automate first?
Start with your highest-frequency, lowest-judgment report — almost always the weekly status update — because it has the fastest payback and the most stable format. Build one self-updating report, measure the hours it saves, then add the next. The compounding pattern is the same one that makes Workspace DNA work: each report you automate feeds the database that makes the next one easier to build.
Here is the rollout most teams follow:
- Week 1 — Automate the weekly status report. Clone a working app, connect one data source, set a Monday schedule.
- Week 2 — Add the KPI scorecard on the same database. The data is already flowing.
- Week 3 — Layer the pipeline summary and let the commentary agent learn your deal language.
- Month 2 — Build the monthly business review on top. It reuses every data pull you already wired.
- Ongoing — Add the executive one-pager and let the system pull from all four reports.
Within a month you have a connected reporting system where each new report reinforces the last, the commentary gets sharper as the agents accumulate memory, and the hours you used to spend assembling updates go back into deciding what to do with them. Start by describing your first report or browsing reporting apps to clone.
Once the reporting loop is running, the same pattern extends to every recurring report in the business. The data agents, the schedule, and the commentary style you built here transfer directly. Teams usually expand into the adjacent domains in this order:
- Automate your accounting close — month-end reconciliation, expense categorization, and invoice digests run on the same multi-agent pattern, with a human approving the final ledger.
- Automate operations reviews — SLA dashboards, incident digests, and capacity reports pull from your ops tools and explain what moved week over week.
- Automate project management — project health, blocker rollups, and sprint summaries write themselves from the same task database that feeds your status report.
- More AI dashboard examples — twelve cloneable dashboards (CRM, growth, support, finance) you can clone in one click and connect to your data.
Each of those reuses the agents, automations, and Projects database you already built — that is the compounding the Workspace DNA loop is named for.
Pricing — what does automated reporting cost?
Automated reporting in Taskade Genesis is free to start, and the paid tiers replace a stack of separate dashboard, scheduling, and reporting tools with one app. Because the database, the agents, the automations, and the dashboard all live in the same place, most teams cut total reporting software spend after consolidating. Here are the annual-billing plans:
| Plan | Price (annual) | Best for |
|---|---|---|
| Free | $0 | Try your first self-updating report |
| Starter | $6/mo | Solo ops, a handful of reports |
| Pro | $16/mo | Growing teams, more agents |
| Business ★ | $40/mo | Full reporting operating system (Popular) |
| Max | $200/mo | High-volume, many connected sources |
| Enterprise | $400/mo | Org-wide reporting + governance |
Business carries the Popular pill because it is the sweet spot for a full reporting operating system — enough agents, automations, and integrations to run every recurring report in one workspace. You can start on Free and only move up when the number of connected reports outgrows it. See the full breakdown on the pricing page.
Frequently asked questions
How do you automate reporting and dashboards with AI in 2026?
You hand each recurring report to an AI system that pulls the data, formats it, writes the commentary, and refreshes the dashboard on a schedule. In Taskade Genesis you describe the report in plain English and it builds the data pulls, the agents, the automations, and a live dashboard app. Teams reclaim the 8-12 hours a week they used to spend assembling status updates.
Can you really automate 99 percent of reporting?
Yes — the repeatable 99% is data pulls, formatting, chart refreshes, rollups, and first-draft commentary. The 1% you keep is the judgment call: deciding what a surprising number means and what to do about it. The machine assembles and explains; the human decides.
What kinds of reports can I automate?
Weekly status reports, monthly business reviews, project health dashboards, KPI scorecards, pipeline summaries, support digests, and executive one-pagers. Each lives in a real app with a database and 7 project views, so the same data renders as a table for analysts and a dashboard for leadership.
How much time does automated reporting save?
Teams typically reclaim 8-12 hours a week per person who used to build status updates by hand. A weekly report that took two hours now refreshes itself overnight, and the AI commentary drafts the what-changed-and-why before anyone opens it.
How does AI write the commentary?
A commentary agent compares the current period to the previous one, finds the largest movements, and drafts a plain-language cause for each. Agents carry persistent memory, so they learn your metrics and write in your team's language. A human approves before it ships.
Do I need to code to automate reporting?
No. Taskade Genesis is fully no-code. You describe the report and it builds the data connections, the agents, the database, the schedule, and a shareable dashboard. An IT program manager can ship a self-updating weekly report in an afternoon without a data engineer.
How do AI reports connect to my data?
Through 100+ bidirectional integrations — triggers pull data in from your tools, actions push the finished report back out to chat, email, or a doc. One automation can read fresh numbers, write the commentary, and post the dashboard link in one run.
Is automated reporting accurate?
Yes, when the data pulls are deterministic and a human reads the final draft. The reliable pattern is a multi-agent team — a data agent validates, a commentary agent drafts, a reviewer flags anomalies, a human approves. Scheduled pulls usually contain fewer errors than hand-built reports.
How is this different from a BI dashboard tool?
A BI tool draws charts from data you connect. An AI reporting system pulls the data, draws the charts, and writes the narrative that explains them. It tells you pipeline dropped because two deals slipped, not just that the line went down. See AI dashboard examples for the chart side and AI project estimation tools for forecasting.
How is this different from Power BI Copilot, Tableau Pulse, and ThoughtSpot?
Those are dashboard tools — they draw charts and summaries from a data source you already modeled, and some (like Power BI Copilot) require enterprise licensing before the AI turns on. Taskade Genesis starts earlier: you describe the report and it builds the database, the multi-agent team, the scheduled automations, and a cloneable dashboard as one app. See the full landscape in AI dashboard builders.
Do I need a data warehouse to automate reporting?
No. Most BI tools assume a modeled warehouse to connect. Taskade Genesis ships the database with the app, so a team without a data engineer can build a self-updating report by describing it and wiring their existing tools through 100+ integrations. The numbers flow in from your CRM, sheets, and project tools — no warehouse required.
How much does it cost?
Free to start. Annual-billing plans are Starter $6/mo, Pro $16/mo, Business $40/mo (Popular), Max $200/mo, and Enterprise $400/mo. One platform replaces a separate dashboard tool, scheduler, and reporting service, so most teams cut total reporting spend after consolidating. See pricing.
Build your reporting operating system today
Reporting in 2026 is not a weekly chore — it is a living system that pulls data, refreshes dashboards, and writes the commentary that explains what changed, all on a schedule. You keep the 1% that needs you: deciding what the numbers mean. Stop assembling status reports by hand and start describing the report you want. Clone a working reporting app, connect your data, set the schedule, and let it rebuild itself every cycle. Explore AI agents for the commentary, automations for the data pulls, and dashboard examples for inspiration.
Memory feeds Intelligence. Intelligence drives Execution. Execution creates Memory. That is the loop that turns reporting from a recurring cost into a system that gets smarter every cycle.
▲ ■ ● Built with Taskade — Memory, Intelligence, Execution in one workspace.