


At this point, there must be a thousand different project management tools and methodologies in the wild. But sometimes, old, tried-and-true methods work the best. In this guide, we’re settling the ultimate debate: Gantt Chart vs. Roadmap. Which one helps navigate projects more effectively?
Here’s the thing. Both Gantt charts and roadmaps have their place. One is excellent for detailed timelines and tracking progress, while the other helps capture the big picture and strategic direction.
This article will show you the key differences between Gantt charts and roadmaps, explore their unique advantages, and help you decide when to apply each of these tools. Let’s get started.
💡 Note: New to the topic? Check our comprehensive guide to Gantt charts first.

🔎 Definition and Overview
What Are Gantt Charts?
Gantt Charts are visual tools used to plan, schedule, and monitor specific tasks and project timelines. And while this may not sound all too exciting, they have a few tricks up their sleeve.
A typical Gantt Chart comes in the form of a timeline with horizontal bars representing individual tasks. The position and length of each bar reflect the task's start date, duration, and end date.

🥟 Did you know? Pierogi aren’t the only fantastic thing to come out of Poland. Before Henry Gantt popularized the chart named after him, Polish engineer Karol Adamiecki developed a similar tool called the "harmonogram" in the late 19th century.
Every time you start a new project, you list all your tasks on the left, estimate how long each will take, and determine their dependencies. Once this is done, you map this information into the chart.
Simple, right?
Gantt Charts are incredibly flexible too. You can use them in a variety of settings and use cases including marketing campaigns, construction projects, software development, and event planning. They are also a great asset in industries such as healthcare, education, and manufacturing.
What Are Roadmaps?
Just like Gantt charts, roadmaps are visual tools that detail critical goals and milestones on a simplified timeline. They provide a strategic overview and key information about a project.
Roadmaps take the form of charts, with colors and symbols highlighting different stages and priorities. Additional labels and legends provide context at a glance, without overwhelming detail.
The workflow is simple. First, you identify key phases, milestones, and objectives. Then, you need to arrange them on a timeline segmented into weeks, months, or quarters.
🏛️ Did you know? Roadmaps may date back to military logistics plans in the Roman Empire. The first known road map was created by John Ogilby in 1675 and detailed 7,500 miles of British roads with a scale of one inch to a mile.
So, where do roadmaps come in handy? The short answer is: everywhere.
You can use them for launching a new software feature, planning a marketing campaign, and managing product release cycles. Roadmaps help software development teams track releases, enable marketing departments to sync campaign activities, and guide product managers in outlining future updates.
Phew… that’s a lot to digest, so let’s see how Gantt charts and roadmaps differ on a macro level.
📏 📐 Key Differences Between Gantt Charts and Roadmaps
Level of Detail
One of the most important differences between Gantt charts and roadmaps is how much they show.
Gantt charts are designed for detailed task-level planning. They outline specific activities, deadlines, and dependencies, which makes them perfect for in-depth tracking down to individual responsibilities.
Roadmaps, on the other hand, offer a high-level overview. They highlight major milestones and phases without delving into details. This makes them suitable for communicating long-term vision.
Time Frame
Another key difference between Gantt charts and roadmaps is how they represent time.
Gantt charts are typically used for short- to medium-term planning. They break down tasks into days, weeks, or months. Which is just the thing you need for granular scheduling and tracking.
Roadmaps are designed for long-term planning. They often span months or even years. This long-range approach helps you focus on future developments rather than just on immediate tasks.
Agility and Flexibility
Gantt charts, with their detailed structure and intricate dependencies, are less flexible. Changes in one task can affect the entire timeline, so prepare for frequent tweaks and adjustments.
If you prefer a bit more breathing room, roadmaps are the way to go.
A roadmap can adapt more easily to changes, which allows you and your team to shift priorities without overhauling the entire plan. This also makes them a great match for agile projects.
👁️ Detailed Comparison
Planning and Execution
Gantt charts and roadmaps serve distinct but complementary roles.
Think of the roadmap as an architect's blueprint for a new skyscraper. Just like the architect designs the layout and appearance of the building, the project roadmap outlines the overall vision and major phases.
Once the blueprint is set, a construction schedule (Gantt chart) guides the day-to-day execution.
For example, in construction, laying the foundation involves excavation, pouring concrete, and setting rebar. In a Gantt chart, all phases will be detailed with specific start and end dates and dependencies.
In a nutshell, the roadmap gives you the big picture, while the Gantt chart handles the details.
Stakeholder Communication
Communicating with stakeholders can be… tricky. And by that we mean that it requires clarity, precision, and answering never-ending questions to convey the high-level vision.
Roadmaps offer a bird’s-eye view of a project, which helps align stakeholders on the overall direction. You get to keep everyone informed without getting bogged down by the nitty-gritty.
Gantt charts, on the other hand, break down the project into specific tasks and show how they interconnect. Perfect for when you need to pinpoint exactly who to blame (just kidding).
Resource Management
Charts and roadmaps are not only about what you see, but also about how you manage what you have.
Roadmaps help you allocate resources at a strategic level. For example, in a software development project, they can show you when to hire additional developers, or when marketing efforts should peak.
Gantt Charts handle the day-to-day grind.
If you’re managing a website redesign, a Gantt Chart will detail each task from the design phase to coding to content creation. If your team is falling behind on delivering fresh content, the Gantt Chart will highlight this delay so you can bring additional copywriters on board to meet the deadline.
✨ Use Cases and Scenarios
When to Use Gantt Charts
Gantt Charts are perfect for complex projects with many interconnected tasks.
For instance, in construction, you can't paint until the drywall is finished. Electrical work must be done before insulation. Even landscaping can't start until the exterior is complete.
Now, consider software development. Developers need to finish coding before testers find bugs. Designers create UI elements before developers can implement them. Each task depends on the last.
In both of those scenarios, Gantt charts make the sequence of steps clear. They show what needs to happen and when, which, in turn, helps project managers make plans and keep everything on track.
All that makes Gantt charts ideal for detailed tracking. They allow teams to monitor progress down to individual tasks. This is useful for time-sensitive projects with mostly static deadlines.
When to Use Roadmaps
Roadmaps excel at long-term strategic planning. They outline the big picture and help you see the future. Well, not exactly like in a crystal ball, but they do show the path ahead.
(that’s as much certainty as you’re going to get in project management 🤷)
Let’s say you’re launching a new product.
A roadmap will tell you when to start designing, when to test with beta users, and when to ramp up production. It will also show when marketing should kick in and when to prepare for the big launch.
Use roadmaps whenever you need to communicate the overall vision, align efforts and expectations, brief your team on major milestones, and present long-term goals to stakeholders
Combining Both Tools
Remember what we said at the beginning of this article?
Ok, you don’t have to scroll all the way to the top — Gantt charts and roadmaps are complementary. Not exactly like yin and yang, but close. And you can get much better results using both.
Start with a roadmap for strategic alignment. It will help you set the direction and mark major milestones. It’s like planning a road trip where you need to decide on your destination and key stops.
Once you’re done, move on to a Gantt chart — your step-by-step itinerary. Lay out every task, assign responsibilities, and plan how everything will fit together over time. Using the same analogy, it's like planning what highways you'll take, when you’ll stop for gas, and where you’ll park overnight.
Most project management tools out there lets you do one or the other, but not both.
Taskade offers the best of both worlds, seamlessly integrating roadmaps and Gantt charts in one platform. Here's everything you need to know to get started. 👇
🐑 Creating Gantt Charts and Roadmaps in Taskade
If you’re new here, here’s a tl;dr.
⚡️ Taskade is an AI-powered project management platform that lets you organize tasks, set priorities, chat, and get work done with your team in one palce. It also happens to pack a powerful Gantt chart view and a Roadmap feature, both integrated into the core workflow.
With introductions out of the way, we can move to the main course — the setup.
Build a Roadmap in Your Workspace
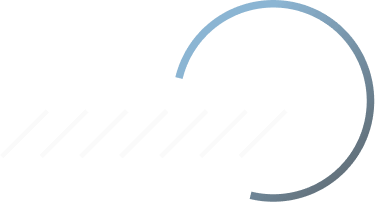
The Roadmap feature is part of every workspace and folder in Taskade (these are containers for all your projects). To access it, simply click the drop-down button next to the name of your space ➡ Roadmap.
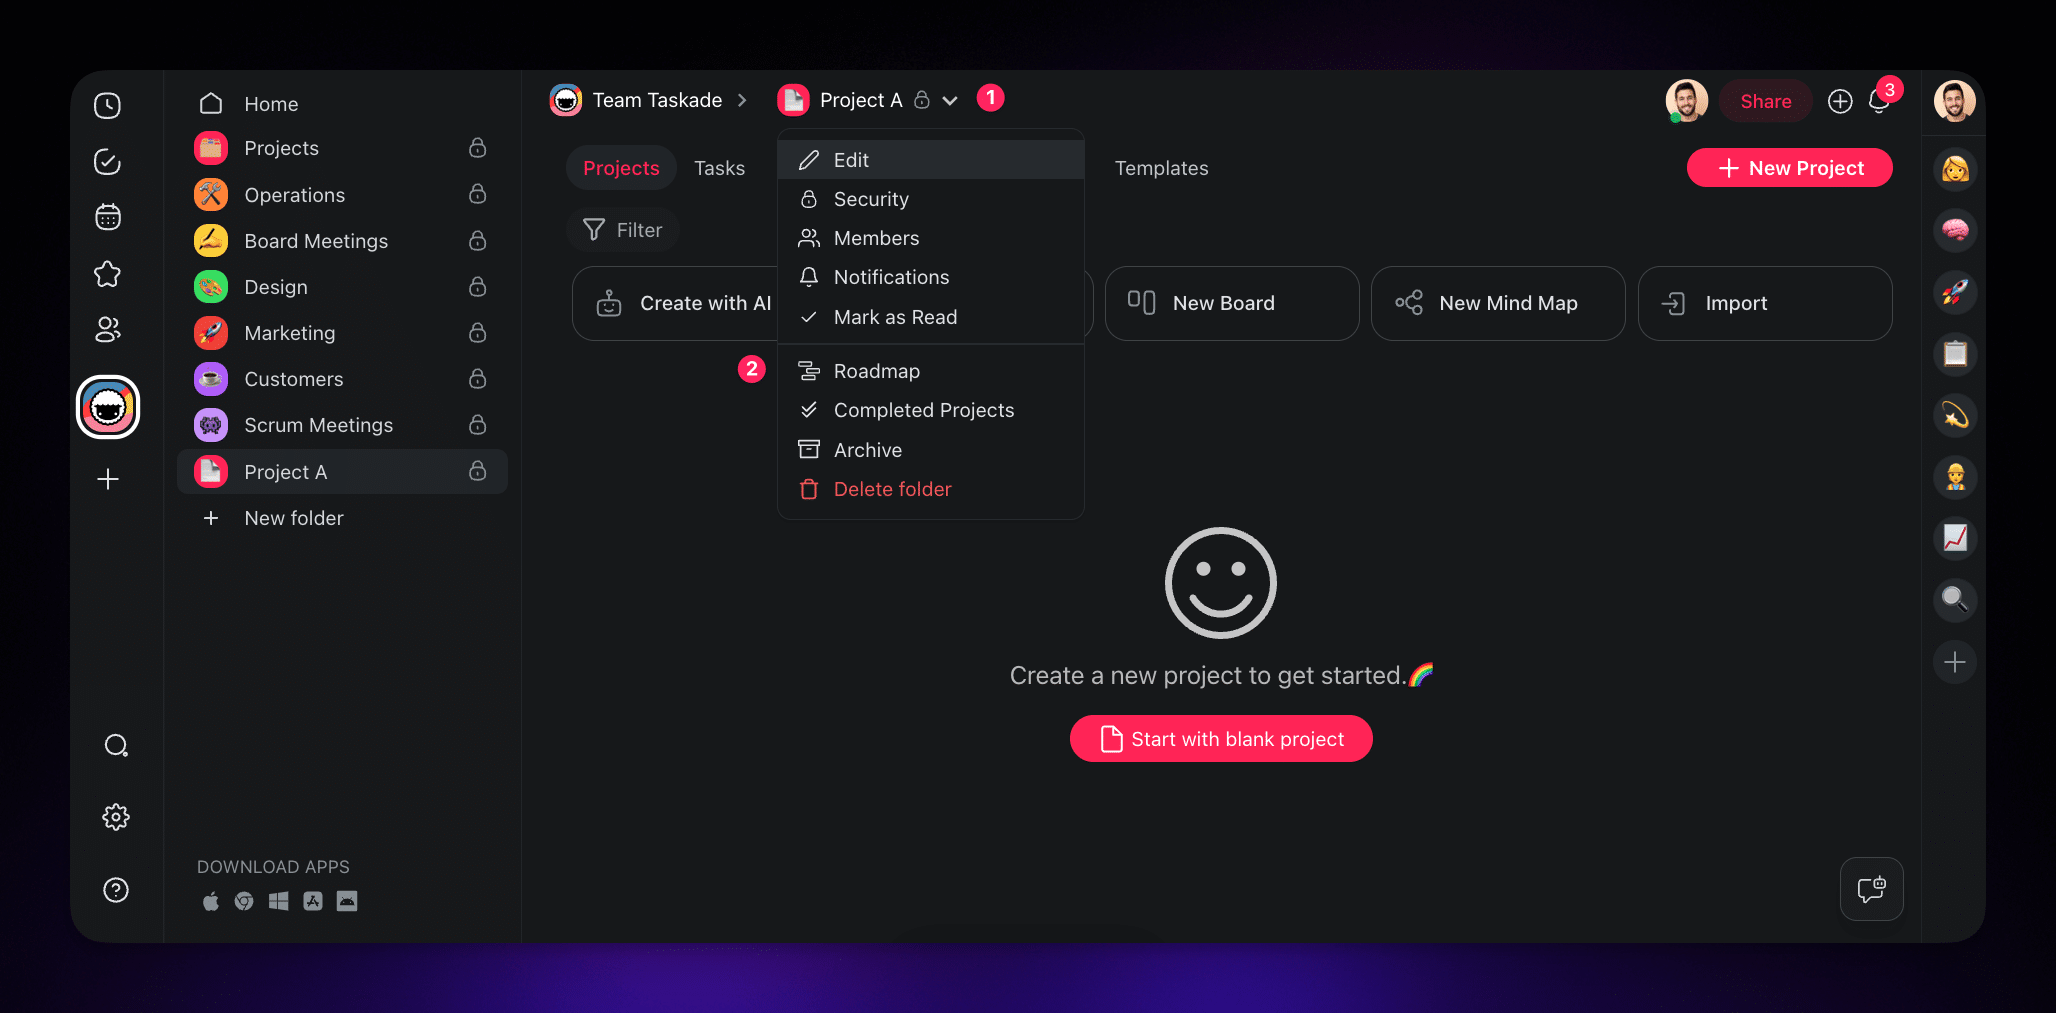
As you can see, our roadmap is empty.
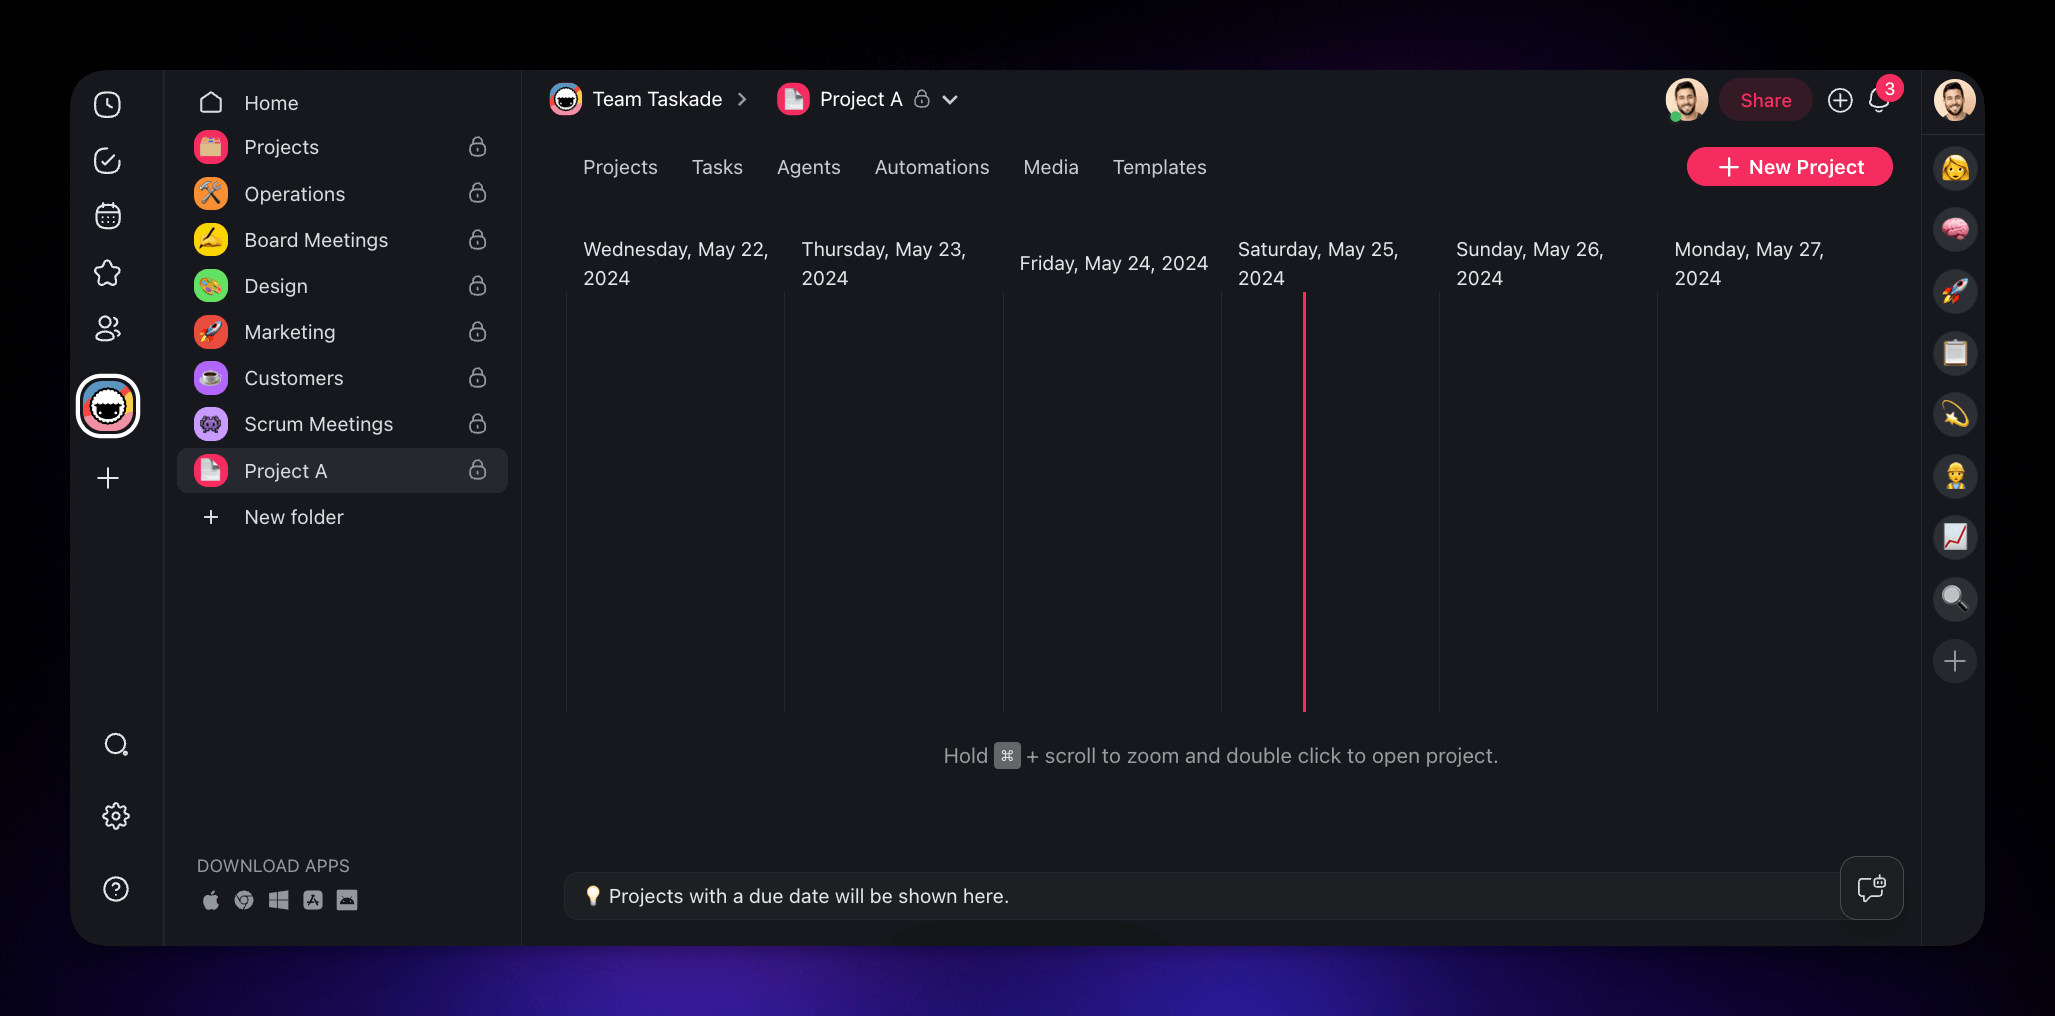
To add an item to the roadmap, you first need to set date ranges for the projects you want to track. In this example, we created a set of items representing different stages within a larger project.
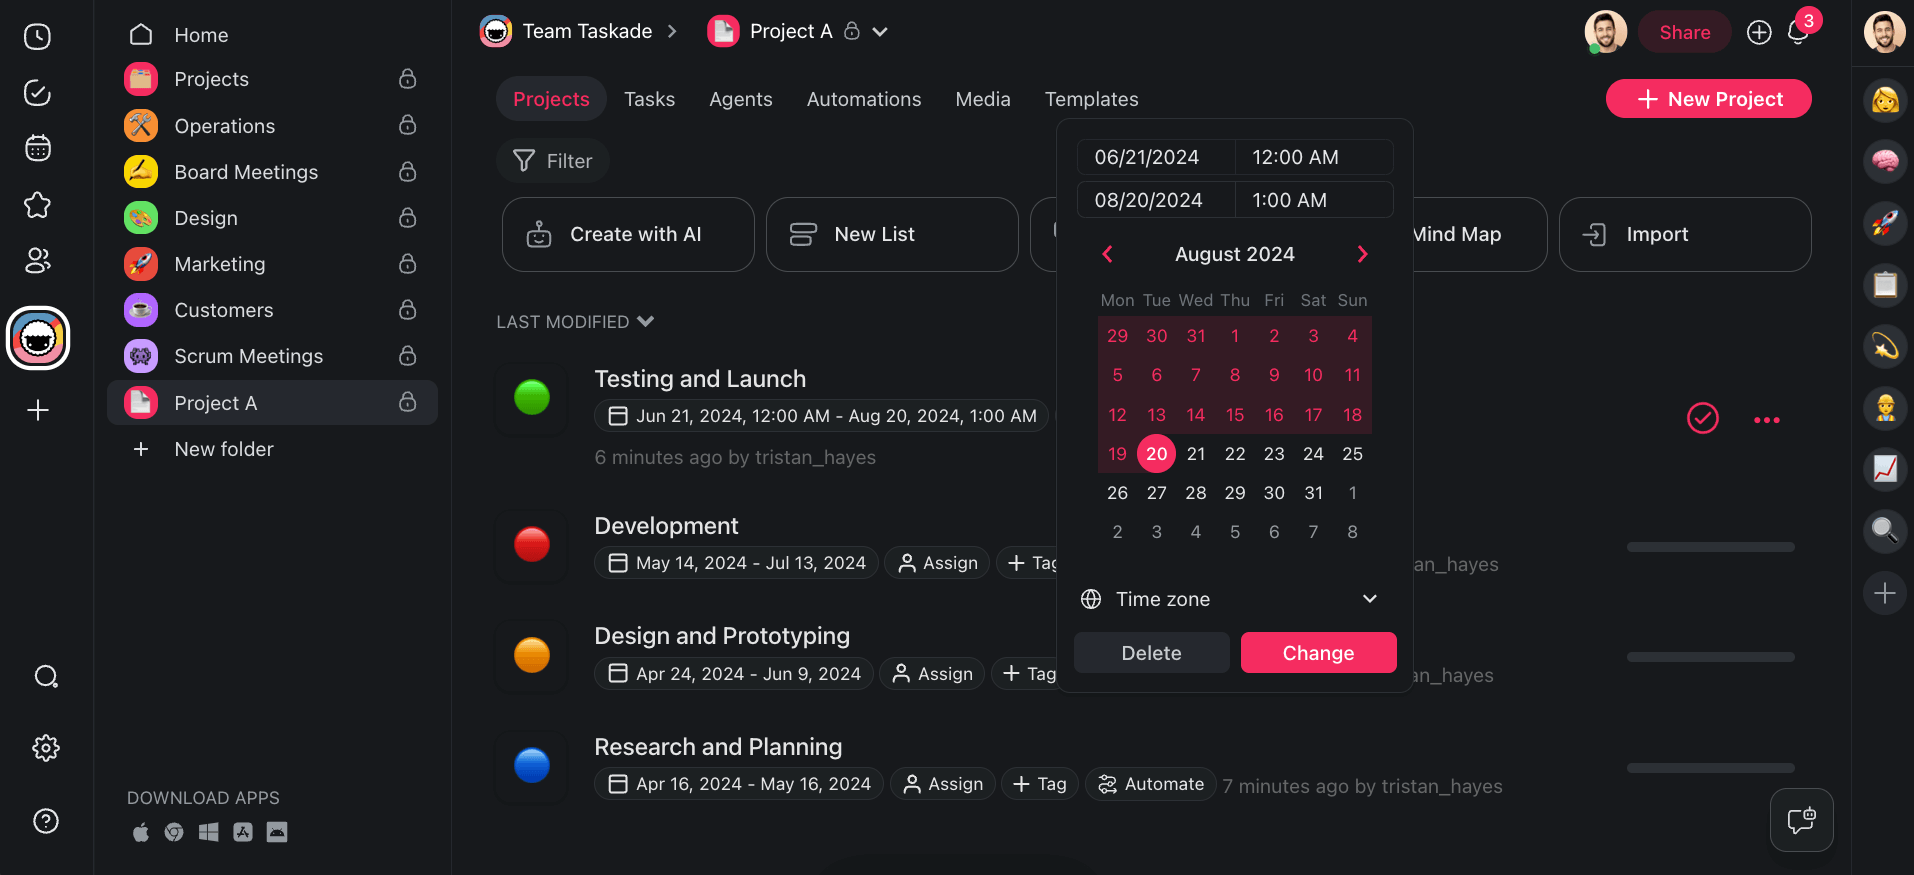
💡Note: Projects are the basic building blocks of Taskade's hierarchy. They can hold your notes, to-dos, mind maps, and any other essential information for organizing your work. However, projects are effectively only containers; they can also represent phases or activities within bigger projects, all of which can be mapped into the roadmap.
Once you’re done, You can easily edit Roadmap items by dragging & dropping the “date pills” to change their date ranges. Select any of the Roadmap items, click-and-hold the corners to adjust the date range, or click-and-hold the central part of a date pill to reposition it on the timeline.
⭐ Pro Tip Pro Tip: Navigating the roadmap is super easy. Use the trackpad or click and hold to drag the timeline left or right. Hold the ⌘ key and scroll to zoom in or out. Finally double-click any of the date pills on the timeline to jump to the target project.
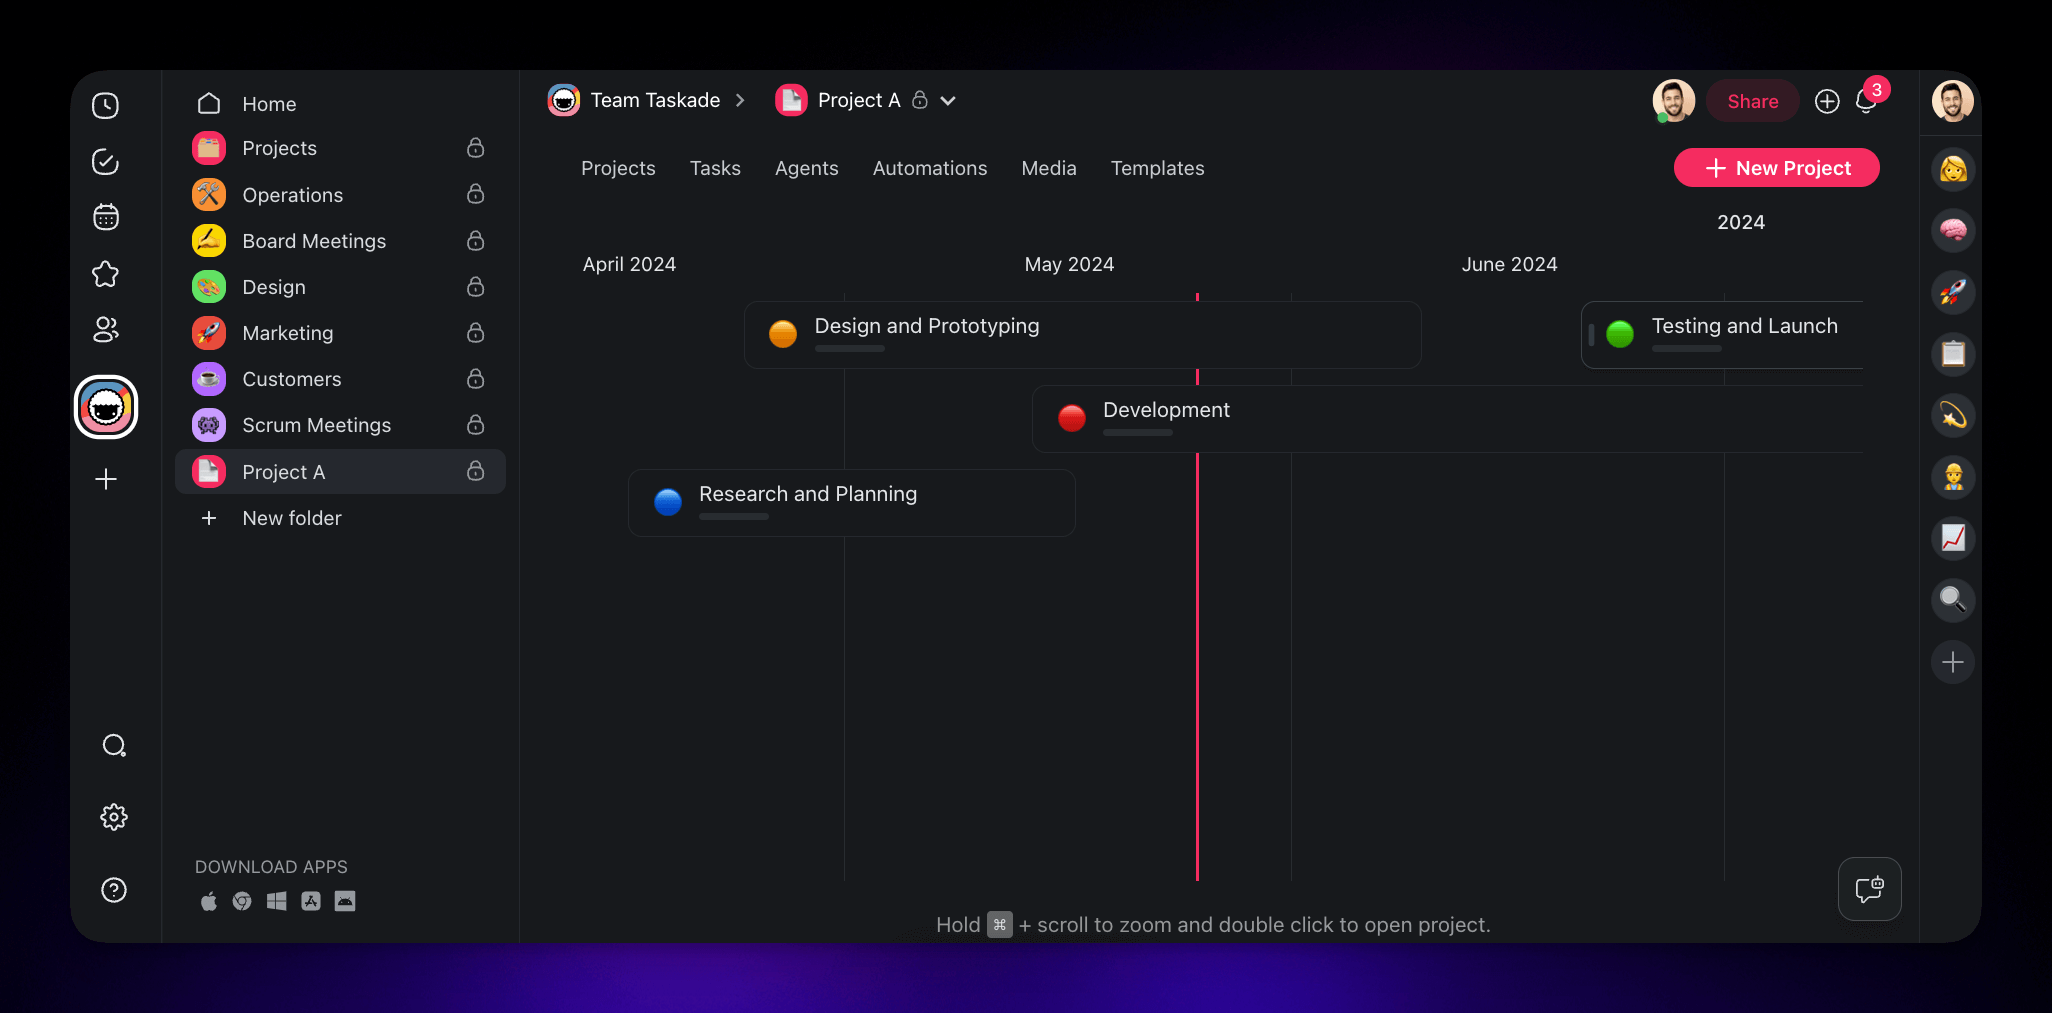
Create a Gantt Chart Inside a Project
The Gantt Chart view is one of seven dynamic workflows in Taskade. Each view gives you a unique perspective on your work, and you can instantly switch between them without losing context.
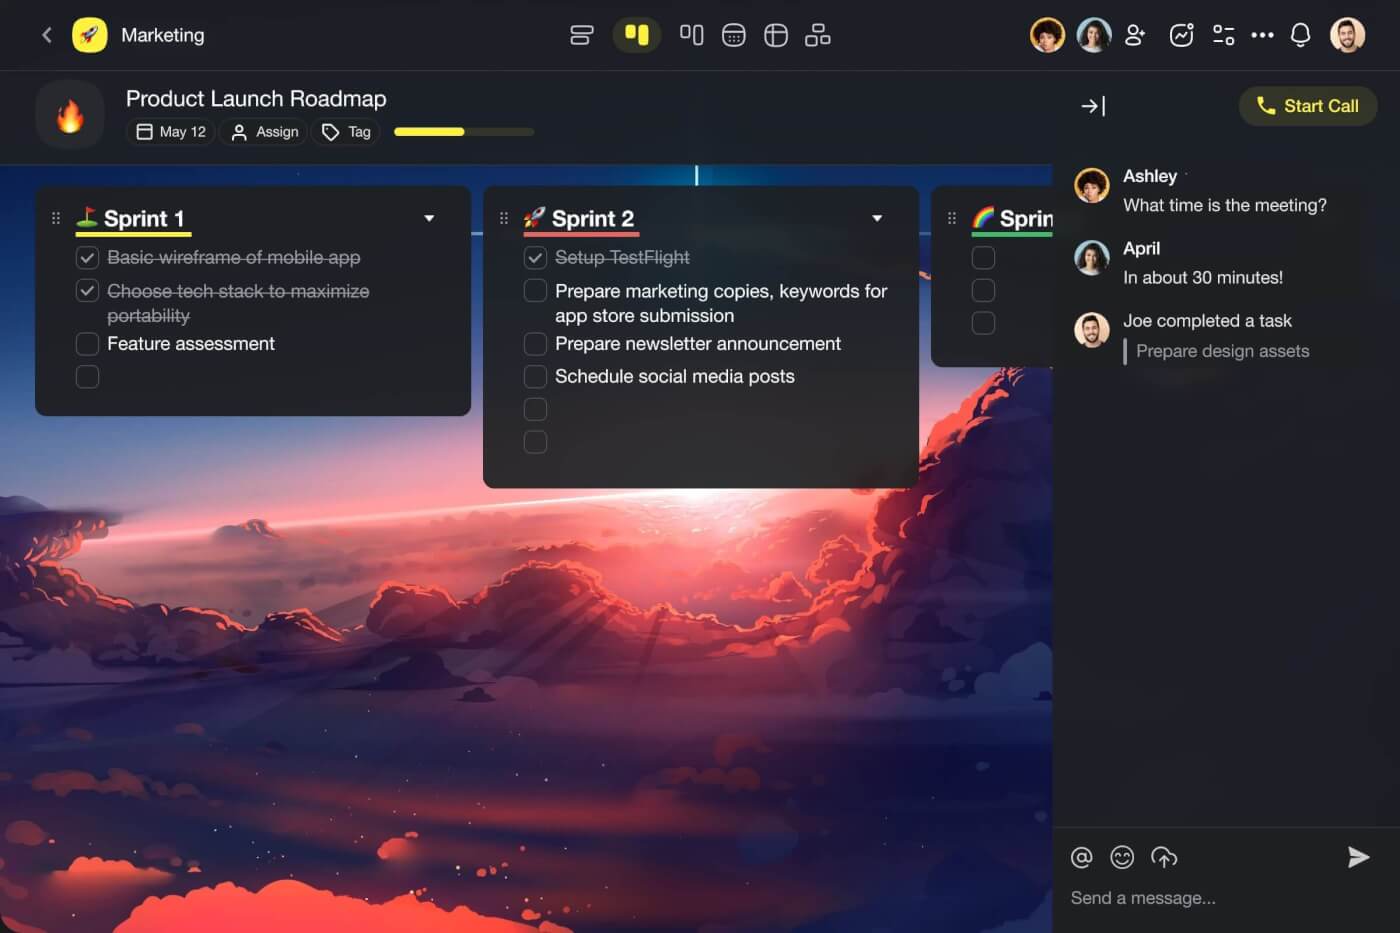
To get started, open the project you want to visualize as a Gantt chart or create a new one.
At the top of your new project, you'll see buttons representing the different views available in Taskade. Type a name for your project, and click on the "Gantt Chart" button (first from the right).
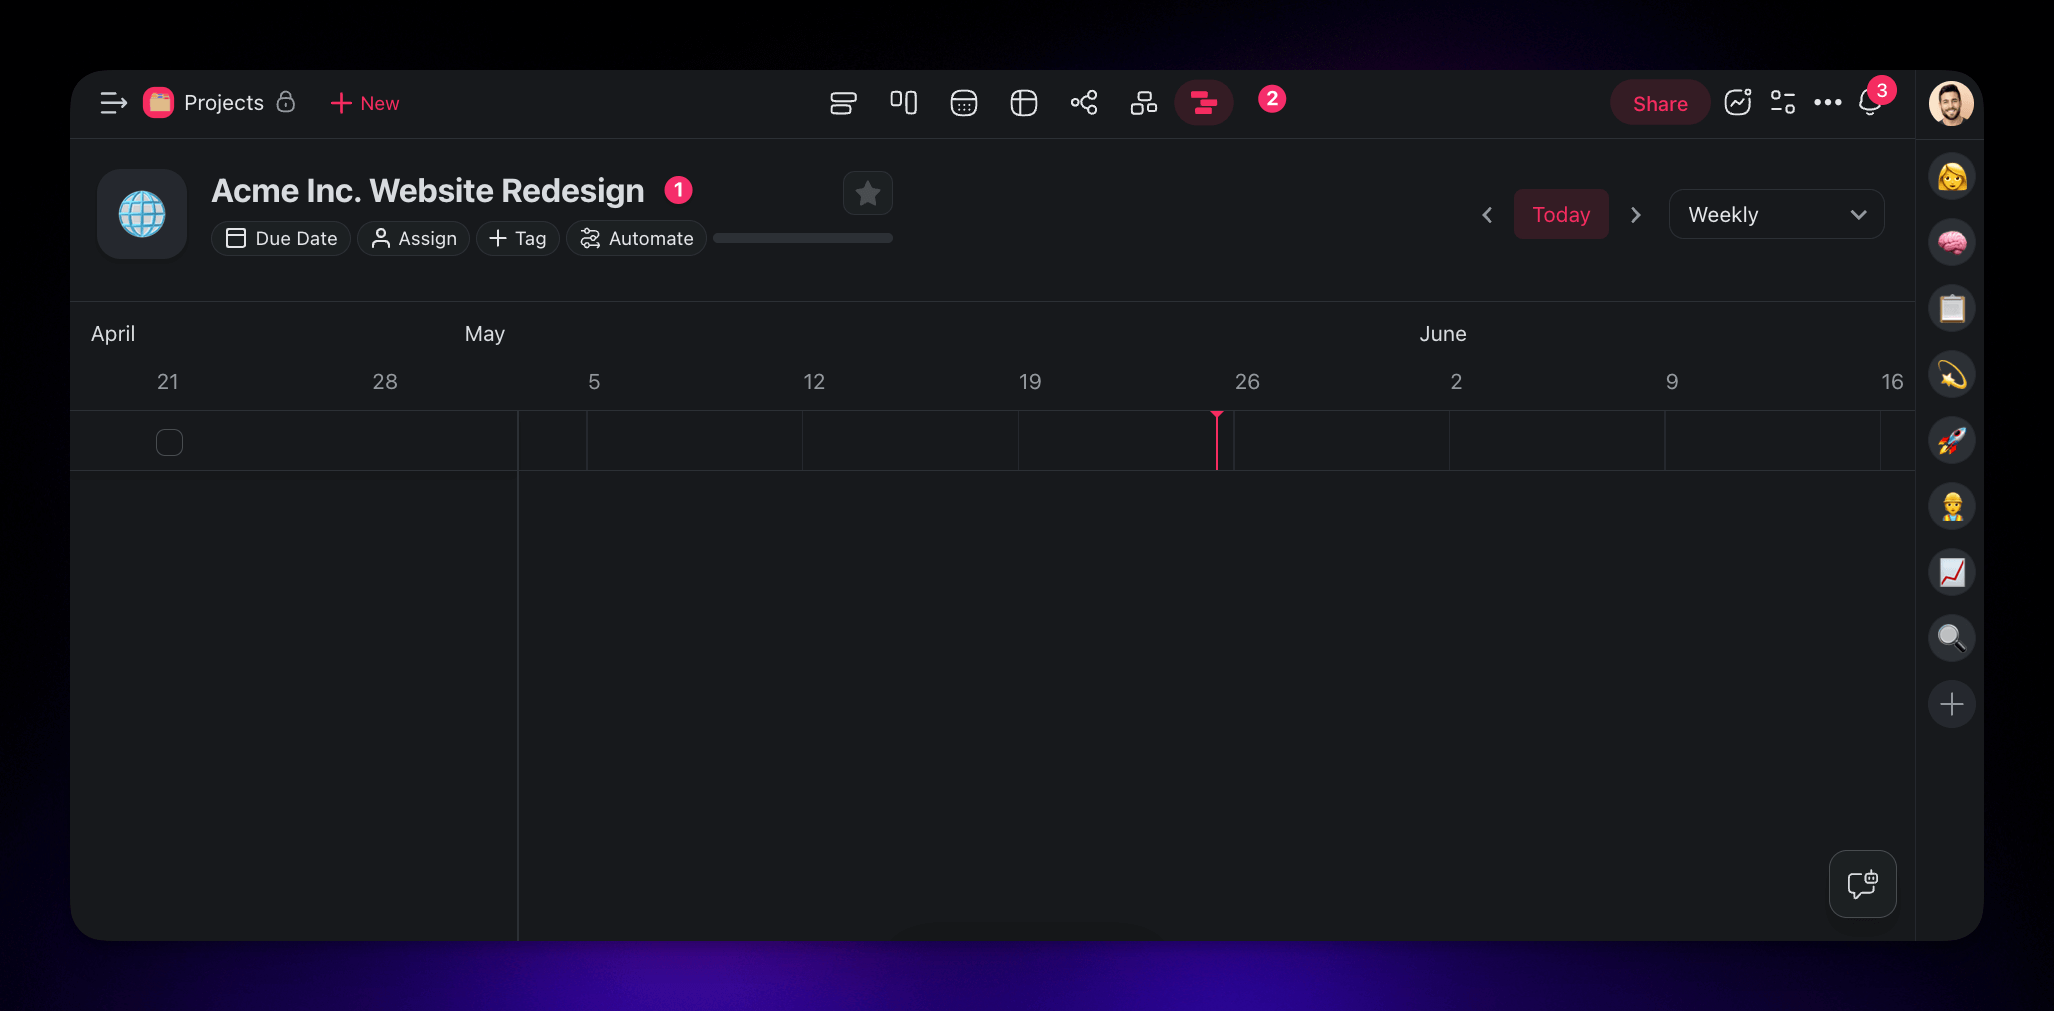
To add a new item to the chart, type your tasks in the first empty line on the left. To make the chart easier to navigate, we organized it into phases and "nested" individual tasks underneath.
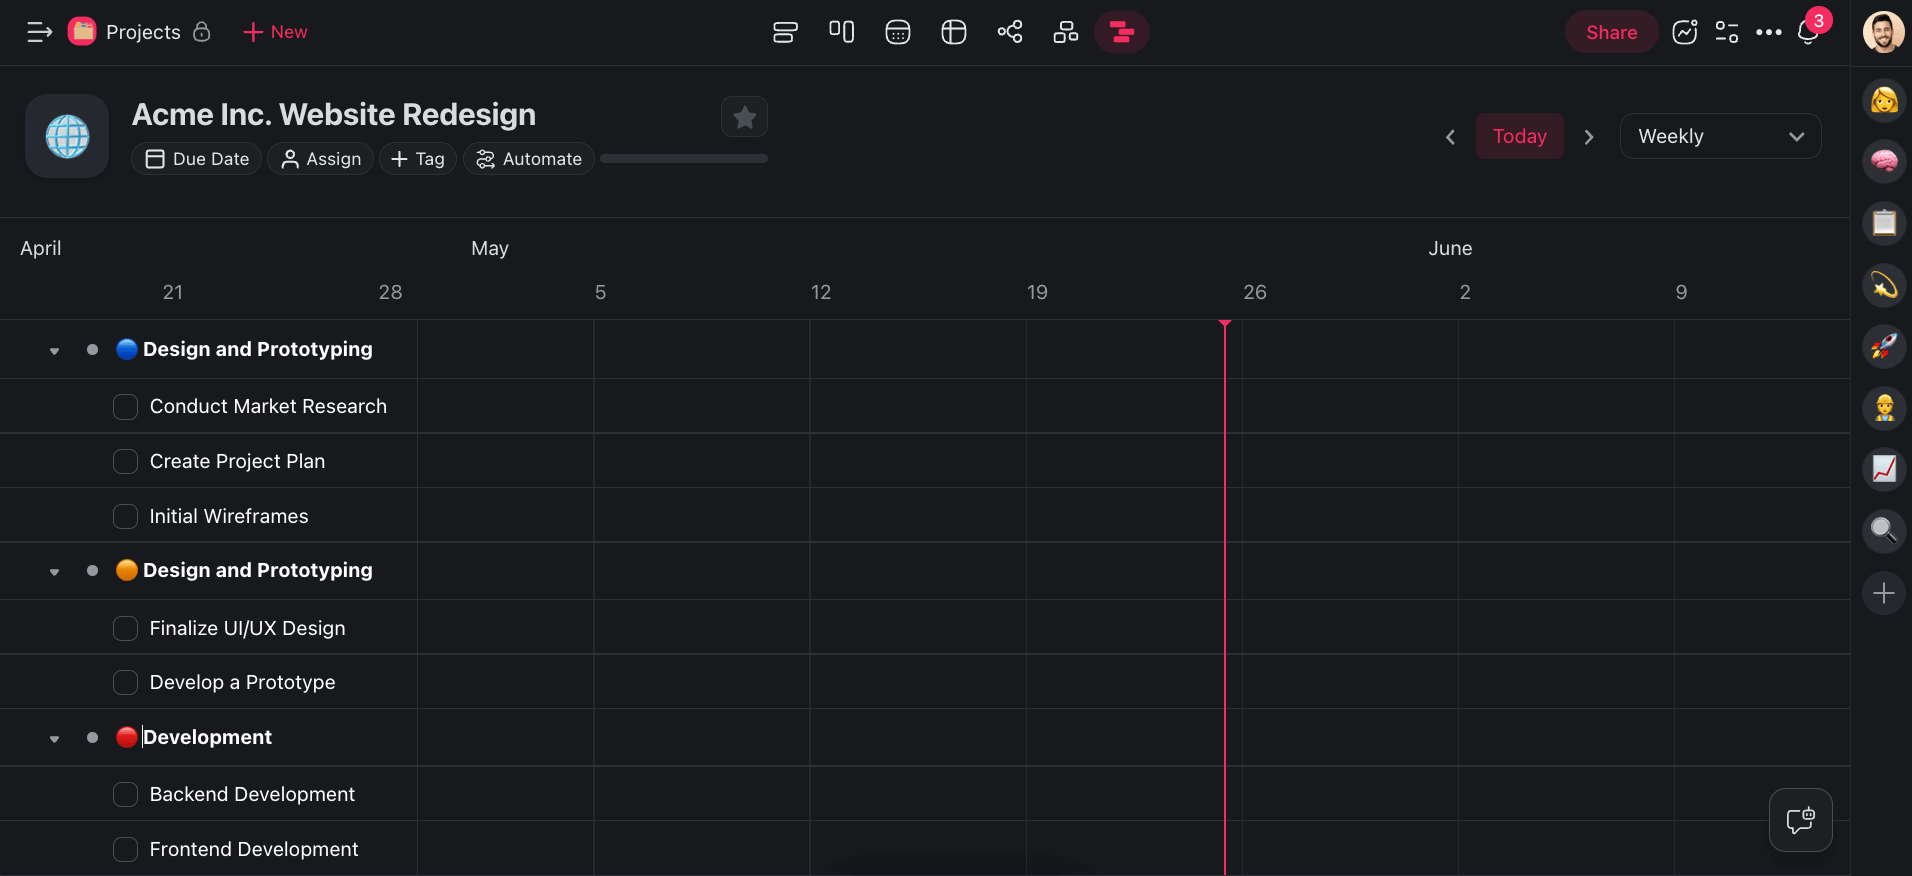
Repeat the step to add as many Gantt chart items as needed.
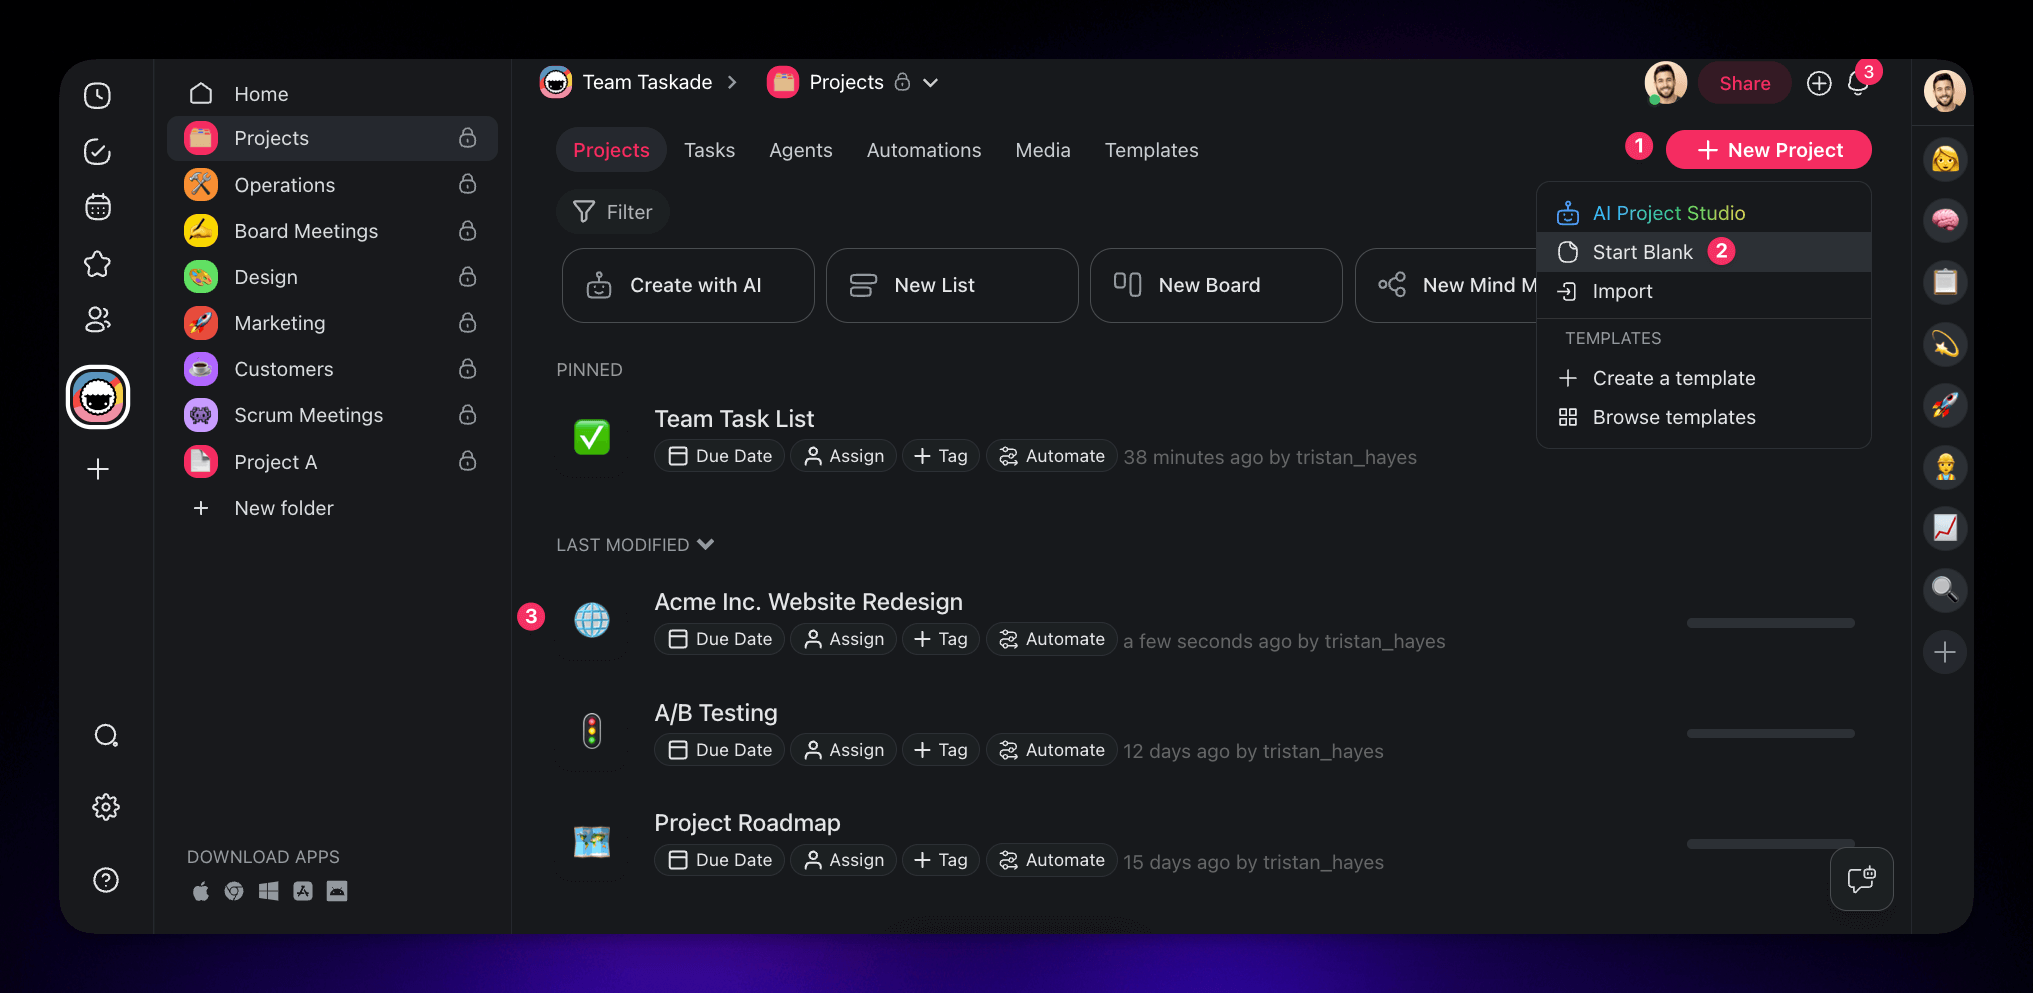
⭐ Pro Tip Pro Tip: Did you know that you can you automatically generate a structure for your Gantt chart using Taskade AI? Click the ➕ New Project button in the top-right corner of your space, choose 🤖 AI Project Studio, describe your project, and hit ⌨️ Enter.
Once the tasks are in place, click the empty space on the timeline to create date pills for each task. Drag the corners of date pills or drag & drag the items themselves to modify their duration.
And that's it!
All that's left is to invite your team to the project and collaborate on the chart!
I
Ready to build your first Gantt chart with Taskade? Want to explore other AI-powered features?
Create a free Taskade account today! 🚀
🔄 Workflow Automation: Connect Taskade to popular apps like Gmail, HubSpot, or Google Sheets to put your projects on autopilot. Build automation flow around your projects and use your custom AI agents to streamline workflows.
✏️ AI Assistant: Plan projects, outline docs, generate action items, and organize everything faster and smarter in the project editor with handy AI /commands. Choose from dozens of built-in commands or create your own.
🪄 AI Project Studio: Craft tasks, projects, or entire workflows in seconds. Describe what you're working on, and Taskade AI will generate a structure for your project. You can even upload your own documents as seeds.
🤖 Custom AI Agents: Build a team of AIs to tackle any tasks. Choose from dozens of AI experts including project managers, data scientists, and engineers, or create your own in a few simple steps. No coding skills needed!
🚀 Strategic Planning Meets Detailed Execution: The Power of Gantt Charts and Roadmaps
Both Gantt charts and roadmaps are excellent tools, each with a set of unique perks. At the end of the day, the choice between the two will depend on your project's unique specs and requirements.
Here are the key takeaways from our discussion:
🔶 Use Gantt charts to display tasks along a timeline, complete with deadlines and dependency.
🔶 Implement roadmaps to outline long-term project goals and major milestones.
🔶 Use both tools together to cover long-term goals as well as daily tasks.
🔶 Start with a roadmap to set the strategic direction, then use a Gantt chart for detailed planning.
Taskade offers the best of both worlds.
With Taskade, you get the best of both worlds. Love Gantt charts for detailed planning? We've got you. Prefer roadmaps for the big picture? No problem. Start organizing your projects today!
💬 Frequently Asked Questions About Gantt Charts and Roadmaps
What is the difference between a project roadmap and a Gantt chart?
A project roadmap offers a high-level overview of a project's long-term goals and milestones; it emphasizes strategic direction and phases. A Gantt chart provides a detailed visual timeline of tasks, deadlines, and dependencies. The roadmap communicates the "what" and "why" to stakeholders, while the Gantt chart deals with the "how" and "when" of task execution.
What is the difference between a Gantt chart and a project plan?
A Gantt chart is a visual scheduling tool that illustrates task timelines, deadlines, and dependencies within a project. In contrast, a project plan is a comprehensive document outlining the project's scope, objectives, deliverables, resources, and risks. The Gantt chart focuses on the detailed scheduling and management of tasks, while the project plan provides broader guidance on project execution and control. Essentially, the project plan sets the foundation, and the Gantt chart organizes the specific activities.
Is a roadmap a Gantt chart?
No, a roadmap is not a Gantt chart. A roadmap is a strategic tool that outlines the project's vision, major milestones, and long-term goals, providing a high-level overview. In contrast, a Gantt chart is a detailed scheduling tool that shows specific tasks, their durations, and dependencies on a timeline. While they serve different purposes, both are essential for effective project planning and execution.
What is the difference between a project roadmap and a project timeline?
A project roadmap highlights the project's long-term goals, key milestones, and strategic direction. A project timeline, on the other hand, details the chronological sequence of events and tasks within the project, focusing on the specific scheduling of activities and deadlines.
What does a project roadmap include?
A project roadmap typically includes the project's vision and objectives, key milestones, and major deliverables. It outlines the high-level phases or stages, along with a timeline for major milestones. On top of those elements, it may highlight strategic initiatives, dependencies, and potential risks.