


Most construction software was built for the big general contractor, not the three-truck specialty crew. You log into someone else's platform, pay per seat every month, and bend your workflow to fit their screens. Taskade Genesis flips that. You describe how your crew actually runs the day, and it builds a construction operations dashboard you own, jobs, crews, daily logs, punch lists, cost codes, and the schedule on one screen, for a flat $0 to $40 a month. Build yours with AI or clone a working one in a click.
TL;DR: A construction operations dashboard tracks active jobs, crews and equipment, daily logs with weather and photos, the punch list, cost-coded budget, and the schedule on one screen. With Taskade Genesis you build it by describing it, no code, then own the app for a flat $0 to $40 a month instead of paying per seat forever. Build yours free →
![]()
What Is a Construction Operations Dashboard?
A construction operations dashboard is one screen that shows every active job, who is on it, what got done today, what is left, and whether the money is on track. For a small contractor it replaces the pile of spreadsheets, group texts, and whiteboards that usually run the business. The whole point is to answer three questions at a glance: where does each job stand, who is where today, and are we making money on it.
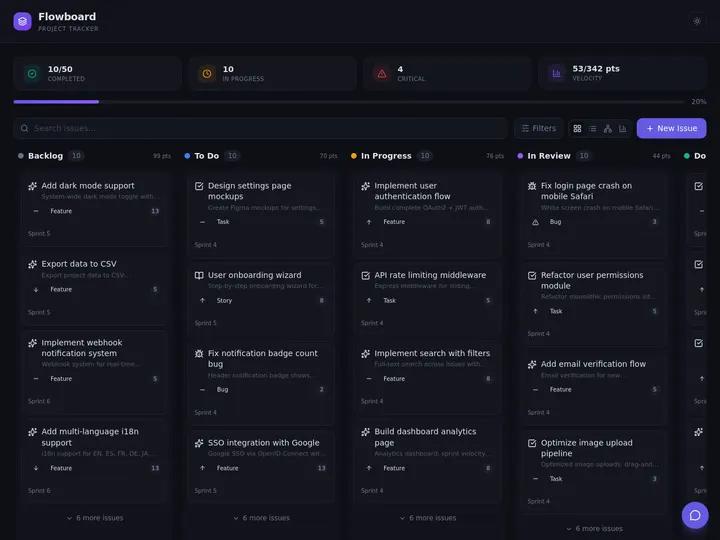
Underneath all of it is one simple thing the dashboard tracks for every job: its stage. A job moves through a predictable lifecycle, and the dashboard's whole job is to show you exactly where each one sits at a glance. On a Board view, each stage is a column and a job is a card you drag from one to the next.
A real dashboard for a small contractor or specialty trade tracks six things. Each one is a list a crew already keeps somewhere, just scattered. The table below is the standard layout, and the rest of this guide shows how to build it without code.
| What it tracks | Why it belongs on the dashboard |
|---|---|
| Jobs and status | Every active job, its stage (bid, scheduled, in progress, punch, closed), and its address on one list |
| Crews, equipment, subs | Who and what is assigned to which job today, so two jobs never grab the same skid steer |
| Daily logs | Weather, headcount, hours, work done, delays, and site photos filed from the field each day |
| Punch list | Open items per job, who owns each, and whether the customer has signed off |
| Cost-coded budget | Labor and material costs tagged to cost codes, compared against the estimate for variance |
| Schedule | Jobs and milestones on a Calendar or Gantt view so nothing slips and no crew double-books |
The reason this matters: a missed daily log is a lost change-order claim, a double-booked crew is a wasted day, and a cost code nobody tracks is the difference between a profitable job and a break-even one. A dashboard that holds all six in one place is the difference between running the business and chasing it.
What turns those six lists into a dashboard instead of six more spreadsheets is the relationships between them. A daily log belongs to a job. A crew gets assigned to a job for a day. A cost code rolls up to a job's budget. A sub is tied to a scope on a job. When the data model knows those links, the dashboard can answer questions a spreadsheet cannot, like every open punch item across all jobs, or total labor cost by cost code this month. The diagram below is the underlying data model a small contractor's dashboard needs.
In Taskade Genesis you do not draw this diagram or write a schema. You describe the lists in plain language and it builds the linked tables for you. The relationships are what make it a real app instead of a pretty spreadsheet.
Spreadsheet vs Rigid SaaS vs Build Your Own
There are three honest ways to run construction operations, and each trades something. A spreadsheet is free and bends to anything, but it cracks the moment three people edit it, photos and weather logs pile up, and the schedule needs a real calendar. Rigid construction SaaS fixes the structure but locks you into someone else's layout and charges per seat forever. Building your own with AI keeps the spreadsheet's flexibility and the SaaS structure, and you own the result.
The build-your-own path used to mean hiring a developer. It does not anymore. You describe the dashboard the way you would explain it to a new hire, and Taskade Genesis turns that into a working app with a real database, seven project views, and automations already wired in. This is the same build a business app without code approach that operators use to build an internal tool in an afternoon.
Construction Software Pricing: Procore vs the Alternatives
Most construction platforms are priced for the large general contractor, not the small crew. Procore does not publish per-seat pricing at all. It sells annual contracts priced on your construction volume, and reported totals commonly land between $10,000 and $80,000 a year, with no free tier. That is the right tool for a big GC drowning in RFIs and submittals, and the wrong tool for a contractor running six jobs.
The table below compares the common options against building your own. Pricing reflects publicly reported 2026 figures and changes often, so confirm current numbers with each vendor.
| Tool | Pricing model (2026) | Free tier | Best for |
|---|---|---|---|
| Procore | Annual contract by volume, commonly $10,000 to $80,000 a year | No | Large GCs with deep RFI and submittal needs |
| Buildertrend | Quote-based, historically about $499 to $900+ a month | No | Home builders and remodelers wanting an all-in-one |
| JobTread | Subscription, mid-hundreds a month range, by plan | No | Estimating-heavy residential and commercial builders |
| Contractor Foreman | Low monthly subscription, among the cheapest full suites | Trial only | Budget-conscious small contractors wanting a full feature set |
| Fieldwire | Free field tier, paid plans per user above it | Yes (field tier) | Field task and plan management on the job site |
| Taskade Genesis | Flat per plan: $0 / $6 / $16 / $40 a month | Yes (full build and clone) | Small contractors who want to own the app and change it themselves |
The difference is not just the number. With every tool above except Taskade, you are renting access to someone else's platform and paying for each person you add. With Taskade Genesis you build the app once, own it, and the price is flat per plan whether you have one foreman or ten. Caps are simple: Free is one user, Starter is three, Pro covers up to ten, and Business and above are unlimited seats. There is no per-task, per-update, or per-user metering.
The Real Cost Over Three Years
The monthly number hides the real gap. Construction SaaS is priced per seat, so the bill climbs every time you add a field user, and an annual platform like Procore renews at the same five-figure level year after year. A dashboard you build and own does not. The table below puts a ten-person crew on each model over three years, using each vendor's published pricing band (figures are illustrative, confirm current pricing with each vendor).
| Option | Year 1 | 3-year total | What you own at the end |
|---|---|---|---|
| Procore (small-contractor band) | $10,000 to $80,000 | $30,000 to $240,000 | Nothing, access ends when you stop paying |
| JobTread (1 user + 9 seats) | Mid-hundreds per month, by plan | Low-to-mid five figures | Nothing, access ends when you stop paying |
| Contractor Foreman (team plan) | Hundreds per month | Low thousands | Nothing, access ends when you stop paying |
| Taskade Genesis Pro (up to 10 users, flat) | $192 | $576 | The app and the data, both yours |
Two things stand out. The flat plan is a fraction of the per-seat options, and at the end you still have the app. With every rented platform, the day you stop paying is the day you lose access to the system your business runs on. With a dashboard you built in Taskade Genesis, you own the app and the data, and the free plan runs the whole thing for a solo operator at zero cost.
How to Build a Construction Operations Dashboard in Taskade Genesis
You build a construction operations dashboard in Taskade Genesis by describing it in plain language, then refining it by typing more requests. There is no code and no setup wizard. The flow below is the whole build, start to a working app the same day.
Step 1: Write the prompt
Open Taskade Genesis and describe the dashboard the way you would brief a new project manager. A prompt that works:
"Build a construction operations dashboard for a small contractor. I need a Jobs list with status (bid, scheduled, in progress, punch, closed), address, customer, and assigned crew. A Crews and Equipment list showing who and what is on each job today. Daily Logs with date, weather, headcount, hours, work done, delays, and photos, linked to the job. A Punch List with open items, owner, and customer sign-off per job. A Cost Codes table tracking labor and material costs against the estimate per job, with budget variance. Put the jobs and milestones on a Calendar and a Gantt schedule."
Taskade Genesis reads that and builds a real app with linked database tables, not a static template. Because the projects are connected, a daily log already knows which job it belongs to, and a cost code already rolls up to the right budget.
Step 2: Set up the seven views
A construction dashboard needs different views for different people. Taskade gives you seven project views over the same data, so the office and the field each see the right layout without keeping separate files.
| View | Who uses it | What it shows |
|---|---|---|
| Board | Foreman on a tablet | Jobs as cards by status, drag to move a job to the next stage |
| List | Crew lead | A clean checklist of today's tasks per job |
| Calendar | Scheduler | Jobs and milestones by day, so nothing double-books |
| Gantt | Project manager | The full schedule with dependencies and timeline |
| Table | Office and bookkeeper | Cost codes, budget variance, and labor hours in columns |
| Mind Map | Estimator | Scope broken into phases and tasks before a job starts |
| Org Chart | Owner | Crew structure and who reports to whom on a job |
Each of the seven views answers a different question a contractor asks during the week. Same underlying data, but the layout is chosen for the decision in front of you.
| View | The question it answers | The decision it drives |
|---|---|---|
| Board | Where does every job stand right now? | Move a job to the next stage, spot what is stuck |
| Calendar | What is happening which day? | Catch a double-booked crew before Monday |
| Gantt | Will the schedule hold if this slips? | Resequence jobs and protect a deadline |
| Table | Are we making money on this job? | Catch a cost code running over the estimate |
| List | What does this crew do today? | Hand a clean punch list to the foreman |
| Mind Map | What is the full scope before we bid? | Break a job into phases so the estimate is real |
| Org Chart | Who owns what on this job? | Assign a lead so nothing falls through |
The Board view is the one a foreman lives in on a tablet at the job site. The Table view is where the office reads cost codes and budget variance. Same data, two layouts, no second file to reconcile. The whole dashboard runs in any browser and in the mobile apps, so the field and the office work the same app from a phone, a tablet, or a laptop.
Here is what that Board view looks like to a foreman holding a tablet at the gate. Each column is a stage, each card is a job, and a thumb-drag moves a job forward without typing a thing.
 BID            SCHEDULED       IN PROGRESS     PUNCH LIST      CLOSED
 ┌───────────┐  ┌───────────┐   ┌───────────┐   ┌───────────┐   ┌───────────┐
 │ Oak St     │  │ 12 Maple   │   │ Cedar Lot  │   │ River Rd   │   │ 8 Elm Ct   │
 │ Driveway   │  │ Foundation │   │ Slab pour  │   │ 3 open     │   │ Signed off │
 │ Est $14k   │  │ Crew B     │   │ Crew A     │   │ items      │   │ Invoiced   │
 └───────────┘  └───────────┘   ├───────────┤   └───────────┘   └───────────┘
                ┌───────────┐   │ Pine Ave   │
                │ Hill Dr    │   │ Footings   │
                │ Retaining  │   │ Crew C     │
                │ Crew TBD   │   │ Log filed  │
                └───────────┘   └───────────┘
   drag a card right  ───────────────────────────────────►  to advance a job
Step 3: Add the daily log and punch list
Daily logs and punch lists are where small contractors lose money and disputes, so they get their own structured lists. Each daily log entry captures weather, headcount, hours, work done, delays, and photos, and it links to the job. Each punch list item has an owner, a due date, and a customer sign-off checkbox. Because both link to the job record, the dashboard can show every open punch item and every missing daily log across all jobs in one filtered view.
Step 4: Turn on automations
Automations are what make the dashboard run the operation instead of just displaying it. You set it once and it fires on a trigger or a schedule without anyone clicking. Two automations every contractor should turn on first:
- Daily-report compile: every evening, the dashboard gathers each crew's daily log, with photos and hours, into a single end-of-day report and posts it to the office and the owner.
- Crew-schedule send: every Sunday night, it builds tomorrow's and the week's crew assignments from the Calendar and sends each foreman their schedule, so the week starts without a single phone call.
The daily-report compile is worth seeing step by step, because it is the automation that saves a foreman the worst hour of the day. On a schedule, the automation walks every active job, pulls the day's log, photos, and hours, asks an AI agent to write a clean summary, and delivers one report to the office and the owner. Nobody assembles anything by hand.
That AI agent step is the part a spreadsheet can never do. With Taskade Genesis an agent can read every daily log, flag a job whose actual cost is running past its estimate, and write the report in plain English. Agents carry 34 built-in tools, including web search, file analysis, and persistent memory, so the same agent that drafts your daily report can also watch the budget and surface the one job that is bleeding margin before the month closes.
Step 5: Connect the tools you already use
The dashboard does not have to replace your bookkeeping or chat. It connects to them through 100+ bidirectional integrations. Triggers pull events in, and actions push data out, so the dashboard becomes the hub instead of one more silo:
- QuickBooks: push a closed job's invoice and costs out for bookkeeping, automatically.
- Slack: post the compiled daily report to your crew channel each evening.
- Google Drive: save site photos and signed punch lists to the right job folder.
This is the same run your whole business on one app pattern other operators use, the dashboard holds the work, and the integrations keep your existing tools in sync.
The point is the loop. A job moves to closed on the Board, which fires an automation, which pushes the invoice to QuickBooks, posts the report to Slack, and files the photos to Drive, all without anyone touching a second app. That is the build an ops dashboard without code idea taken one step further: the dashboard does not just show the work, it does the busywork around the work.
Step 6: Let subs and clients log in (Business+)
A foreman and the office run the dashboard, but a job involves more people than that. With App Users on the Business plan and above, you can give a subcontractor a login that shows only their scope on one job, or give an owner a read-only view of their project's progress and photos on your own custom domain. They see a branded view of the dashboard, not a shared spreadsheet link, and they only see what you grant. This is the same build a client portal move that turns an internal dashboard into something you can put in front of a customer.
Job Costing and Daily Logs: The Two Features That Decide Profit
The two features that actually decide whether a small contractor makes money are job costing and daily logs, and any honest review of construction software ranks them at the top. Five capabilities show up on every short list for a small firm: daily logs, document control, activity-level cost tracking, mobile field use, and an audit trail. A built-it-yourself dashboard covers all five, because you describe exactly the fields your trade needs instead of accepting a vendor's template.
Job costing is the one most spreadsheets get wrong. The point is not the total at the end of the job, it is the variance you can see while the job is still open and you can still do something about it. When labor and material costs are tagged to cost codes and compared against the estimate in real time, a job that is drifting over budget shows up as a red number on the Table view weeks before it would have surfaced on an invoice. Here is the scorecard a contractor reads each Friday.
 JOB: Cedar Lot Slab            BUDGET $48,000        AS OF: week 4 of 6
 ──────────────────────────────────────────────────────────────────────
 COST CODE          ESTIMATE    ACTUAL    VARIANCE    STATUS
 01-100 Labor       $18,000     $19,400   -$1,400     OVER  ▲
 02-200 Concrete    $14,000     $13,100   +$900       under ●
 03-300 Rebar       $ 6,000     $ 6,050   -$50        on track
 04-400 Equipment   $ 4,000     $ 3,200   +$800       under ●
 05-500 Subs        $ 6,000     $ 6,000   $0          on track
 ──────────────────────────────────────────────────────────────────────
 TOTAL              $48,000     $47,750   +$250       MARGIN HOLDING
 FLAG: labor 8% over on code 01-100 -> check crew hours on daily logs
Daily logs are the other half. A log filed from the field each day, with weather, headcount, hours, and photos, is what protects a change-order claim and what feeds the job-cost numbers above. Because the log links to the job, an AI agent can read across all of them and flag the connection the scorecard hints at, that labor is over on a job whose daily logs show a string of weather delays. That is the depth the field-reporting and job-costing comparisons reward, and it is the same data model you described in plain language at the start of the build.
For a fuller walkthrough of designing the dashboard tiles and choosing which numbers belong on the top-left of the screen, see how to build an ops dashboard with no code.
A Real Crew Runs a Command Center This Way
This is not hypothetical. A real Taskade customer, a concrete company, runs its entire operation as a command center built exactly this way. They described how their crews, equipment, and pours work, and Taskade Genesis turned it into a dashboard the field and office both run from every day. They did not hire a developer, sit through a sales demo, or pay per seat. What a large firm might have built with a software team over many months, they shipped by describing it in a few weeks. The point of the David pattern is that the operator who knows the work best is now the one who builds the tool for it.
More Live Apps That Slot Into the Dashboard
A construction business needs more than the core dashboard. Equipment and fleet, materials inventory, and the job-flow tracker are all live apps you can clone in one click, point at your data, and run. Because they share the same connected-projects backbone, they plug straight into the operations dashboard above.

The Fleet and Equipment app above keeps every truck, skid steer, and piece of machinery with its assignment and service status on one screen, so two jobs never grab the same equipment. Clone it here.
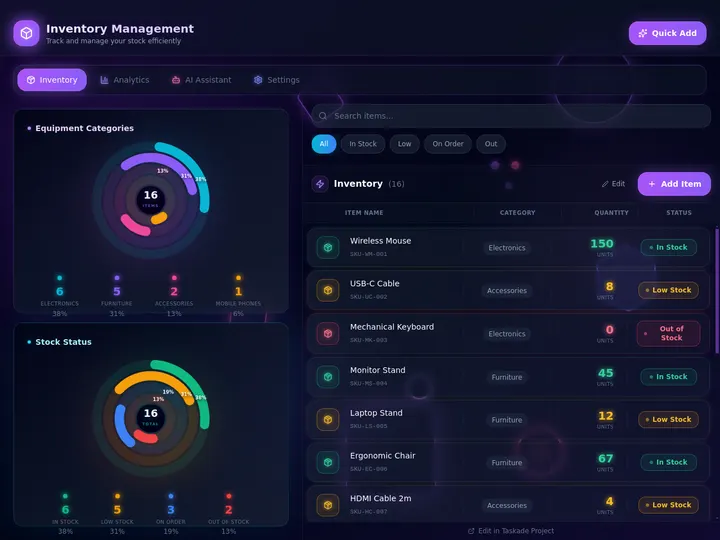
The Inventory Manager above tracks materials stock, low-stock alerts, and reorders, so you find out you are short on rebar before the crew is standing around. Clone it here.
You can browse hundreds more live apps in the Community Gallery, clone the one closest to your trade, and start from a working app instead of a blank screen. Cloning gives you a running app in one click, and from there you describe the changes your crew needs in plain language. If you are weighing this against other tools first, the rundown of AI app builders for business compares the operator-owns-the-app approach against the drag-and-drop and code-generator crowd.
When You Should Stay on Procore
Building your own dashboard is the right move for most small contractors, but not all. Stay on Procore or a similar enterprise platform if you are a large general contractor coordinating dozens of subcontractors with heavy RFI, submittal, and drawing-management workflows, or if a project owner or lender contractually requires Procore on the job. Those deep modules, the document control, the integration with design teams, the buying power behind the contract, are genuinely valuable at that scale, and rebuilding them yourself would not be worth it.
The honest line is about fit, not winning. Procore, Buildertrend, and JobTread are mature, well-built platforms for the contractors they were designed for. The question is whether you are that contractor. A specialty trade or a small crew running its own jobs rarely needs RFI workflows and submittal logs, and pays a steep premium for modules it never opens. For that operator, a dashboard you own and can change yourself for a flat $0 to $40 a month is the better trade.
What It Costs to Run the Whole Thing
You can build and run a full construction operations dashboard on the free Taskade plan, then upgrade only when you want more seats or a client-facing portal on your own domain. Pricing is flat per plan, never per task or per update.
| Plan (annual billing) | Price | Seats | Best for |
|---|---|---|---|
| Free | $0 | 1 | Building and cloning the dashboard solo |
| Starter | $6/mo | 3 | A solo operator with a small office |
| Pro ★ | $16/mo | 10 | A crew up to 10, the popular choice |
| Business | $40/mo | Unlimited | Bigger crews, custom domain, client logins |
One Pro seat at $16 a month covers a ten-person crew on one flat bill. Compare that to a per-seat construction SaaS, where ten field users can run hundreds of dollars a month, or to Procore's annual contract. Custom domains and client logins (App Users) unlock on Business and above, which is what you turn on when you want owners or subs to log into a branded view of their job.
Describe How the Crew Runs. Own the Dashboard.
A construction operations dashboard should match how your crew actually works, not the other way around. You know the jobs, the cost codes, and the way a daily log should read better than any software vendor. With Taskade Genesis you describe it once, and you get a working app with seven views, a real database, and automations that compile reports and send schedules on their own, across 100+ integrations. Then it is yours to change anytime, for a flat price, with no per-seat meter running.
Build your construction dashboard free, or clone a working one and have it running before the first crew rolls out tomorrow.
Read Next
- Run Your Whole Business in One App →, how operators run an ops dashboard, CRM, and client portal as one connected app.
- Build a Business App Without Code →, the step-by-step on turning a plain-language description into a working app.
- Build an Internal Tool Without Code →, the same pattern for back-office tools your team runs every day.
- Set It Once, Let It Run →, how automations keep the dashboard working without anyone clicking.
▲ ■ ● Memory · Intelligence · Execution
The three-layer architecture behind every Taskade Genesis app, connected projects remember your jobs and costs, agents read them, and automations compile the reports and send the schedule. Build your construction dashboard on the same primitives, or clone a live one to feel the loop close itself.
Frequently Asked Questions
What is the best construction operations dashboard for small contractors in 2026?
The best construction operations dashboard for a small contractor is one you own and can change yourself, not one you rent per seat. Taskade Genesis lets you build a dashboard by describing your jobs, crews, daily logs, and budget in plain language. It tracks job status, cost codes, and the schedule on one screen for a flat $0 to $40 a month, with no per-seat fees.
Is there a free construction management software for small contractors?
Yes. You can build and run a working construction operations dashboard on the free Taskade plan, with job tracking, daily logs, a punch list, and the schedule on a Calendar or Gantt view. Fieldwire also offers a free field tier for up to a handful of users. Paid Taskade tiers start at $6 a month and stay flat per plan, not per user.
What is a cheaper alternative to Procore for a small contractor?
Procore is built for large general contractors and is priced by annual contract, often $10,000 to $80,000 a year. For a small contractor or specialty trade, a built-it-yourself dashboard in Taskade Genesis covers jobs, crews, daily logs, and budget for a flat $0 to $40 a month. JobTread, Contractor Foreman, and Fieldwire are other lower-cost options.
How much does Procore cost for a small contractor?
Procore does not publish per-seat pricing. It sells annual contracts priced on your construction volume, and reported totals commonly land between $10,000 and $80,000 a year. There is no free tier. That model fits large general contractors with deep RFI and submittal needs, not a small crew running a handful of jobs.
Should I use a spreadsheet or software for construction job tracking?
A spreadsheet is free and flexible but breaks down once several people edit it, photos and weather pile up, and the schedule needs a calendar. Rigid construction SaaS fixes that but locks you into someone else's layout and per-seat pricing. Building your own dashboard in Taskade Genesis keeps the flexibility of a spreadsheet with the structure of software, and you own it.
What should a construction operations dashboard track?
A construction operations dashboard should track active jobs and their status, crews and equipment and subcontractors, daily logs with weather, headcount, and photos, an open punch list, cost-coded labor and materials against the budget, and the schedule on a Calendar or Gantt view. In Taskade Genesis all of this lives on one screen across seven project views.
Can I build construction management software without code?
Yes. With Taskade Genesis you describe the dashboard you want, your jobs, crews, daily logs, cost codes, and schedule, and it builds a working app with seven project views and automations. No code, no setup wizard, and no developer. A non-technical contractor can have a usable job tracker the same day and refine it by typing more requests.
Can a foreman use the dashboard from a phone or tablet on site?
Yes. A Taskade Genesis dashboard works in any browser and in the mobile apps, so a foreman can open the Board view on a tablet, mark a job complete, file a daily log with photos, and check off punch list items from the job site. The same data syncs back to the office view in real time.
Does the dashboard connect to QuickBooks, Slack, and Google Drive?
Yes. Taskade Genesis connects through 100+ bidirectional integrations. Triggers pull events in and actions push data out, so you can send a closed job to QuickBooks, post a daily report to a Slack channel, and save site photos to Google Drive automatically. You wire each connection once and the automations run on their own.
When should a contractor stay on Procore instead of building their own?
Stay on Procore if you are a large general contractor coordinating many subcontractors with heavy RFI, submittal, and drawing-management workflows, or if owners and lenders require Procore on the project. Those deep modules and the buying power behind them are real. A small contractor running its own jobs rarely needs that depth and pays a lot for it.