


Ask the internet "what do people build with AI" and you get two kinds of answers: SEO listicles of project ideas you could try, and "best AI app builder" roundups selling tools. Neither tells you what people actually build once they sit down and start.
We can. We looked at a first-party census of 471 top-traffic paid apps built on Taskade Genesis — together holding nearly 3,900 connected projects and AI agents — and sorted them by what they actually are. The answer is not websites, and it is definitely not toys.
TL;DR: Most people don't build "apps" with AI — they build business systems: dashboards, trackers, portals, and CRMs. Across 471 top-traffic paid Taskade Genesis apps, 28.2% are dashboards and analytics tools, the single largest category. The average app has 5.9 connected projects and 2.3 AI agents — operational systems, not demos. See what you can build →
What Do People Actually Build With AI?
People build operational business systems with AI — the dashboards, trackers, portals, and CRMs a business runs on. In a census of 471 top-traffic paid Taskade Genesis apps, the largest category is dashboards and analytics at 28.2%, ahead of calculators (12.9%), booking tools (10.0%), and education apps (7.7%). The work is operational, not decorative.
This matters because the dominant public narrative measures ideas and publishing, not operating. Listicles tell you what's possible. Website-builder data tells you what gets put online. Neither captures the thing people quietly build the most: the internal system that runs their day.
By the numbers: the 471-app census
| Signal | Count |
|---|---|
| Paid apps studied | 471 |
| Connected projects across them | 2,778 |
| AI agents across them | 1,078 |
| Average per app | 5.9 projects · 2.3 agents |
| Largest category | Dashboards & analytics — 28.2% |
| Published to the Community Gallery | 211 |
📊 The Census: What 471 AI-Built Apps Actually Are
Of 471 top-traffic paid Taskade Genesis apps, dashboards and analytics lead at 28.2% (151 apps), followed by calculators and tools, booking and scheduling, and education. These are not prototypes — the set holds 2,778 connected projects and 1,078 AI agents, averaging 5.9 projects and 2.3 agents per app.
| Rank | Category | Apps | Share of traffic |
|---|---|---|---|
| 1 | Dashboards & analytics | 151 | 28.2% |
| 2 | Calculators & tools | 8 | 12.9% |
| 3 | Booking & events | 29 | 10.0% |
| 4 | Education & learning | 47 | 7.7% |
| 5 | Project & task systems | 18 | 5.6% |
| 6 | Websites & portals | 19 | 5.1% |
| 7 | E-commerce & inventory | 12 | 5.0% |
| 8 | Music & media | 44 | 3.5% |
| — | Other business categories (CRM, finance, HR, support, legal, logistics) | 82 | 16.1% |
| — | Uncategorized | 61 | 5.9% |
| — | Total | 471 | 100% |
Two columns, two different denominators — read them independently. Apps and share of traffic are not the same measure: traffic is concentrated, not spread evenly per app. The sharpest example is the Calculator row — a single exam-prep publisher's eight calculators drive that category's outsized 12.9% share, the same power-law concentration the remix economy shows at the clone level. And the 16.1% long tail is more operational software — CRM, finance, HR, support, legal, and logistics apps — which only sharpens the headline.
   TRAFFIC IS CONCENTRATED, NOT SPREAD EVENLY
   ──────────────────────────────────────────────────────
   Dashboards   151 apps  ████████████████  28.2%
   Calculators    8 apps  ███████           12.9%  <- 8 apps, huge share
   Booking       29 apps  █████              10.0%
   Education     47 apps  ████                7.7%  <- 47 apps, less traffic
   ──────────────────────────────────────────────────────
   App COUNT and TRAFFIC SHARE are different measures.
   A few proven apps capture most of the attention.
The headline is the concentration: more than a quarter of all traffic flows to dashboards. When non-technical operators reach for AI, they are not making landing pages. They are building the screen they will stare at every morning.
🚪 Publishing vs. Operating: The Half Other Platforms Can't See
Website builders report a publishing census; AI workspace builders reveal an operating one — and they look completely different. Hostinger Horizons data (March 2026, one million users) is 49% business/portfolio websites, 10% ecommerce, 6% content/learning, and just 5% SaaS dashboards and tools, plus a 30% "Other" bucket. That measures what people put online. Our data measures what they run.
   WEBSITE BUILDER (the front door)       AI WORKSPACE BUILDER (the building)
   ──────────────────────────────        ──────────────────────────────────
   49%  Business / portfolio sites        28.2%  Dashboards & analytics
   10%  Ecommerce stores                   12.9%  Calculators & tools
    6%  Content / learning                 10.0%  Booking & scheduling
    5%  SaaS dashboards & tools  ◄──────►    7.7%  Education
   30%  "Other" (uncategorized)            16.1%  CRM, finance, HR, legal, logistics
        = what you SHOW                            = what you RUN
Notice the seam: Hostinger's smallest named slice — "SaaS dashboards and tools," 5% — plus its undifferentiated 30% "Other" is exactly the operational layer a publishing platform can't categorize. That layer is where real business systems live, and on a workspace builder it is the dominant build. Sites are the front door. Systems are the building behind it.
| What it answers | Hostinger Horizons (publish) | Taskade Genesis (operate) |
|---|---|---|
| The question | What did you publish? | What do you operate? |
| #1 category | Business/portfolio sites (49%) | Dashboards & analytics (28.2%) |
| The unit | A page you show | A system you run |
🔁 People Don't Build From Scratch — They Remix
The most revealing fact is not what gets built, but how. In a 30-day window, Taskade Genesis logged 8,042 clone events from 4,599 users against just 60 publish events from 49 users — a remix ratio of roughly 134:1. People overwhelmingly adopt a proven structure and adapt it, rather than originating from a blank prompt.
And fewer than 1.1% of cloners have ever published, so this is cross-user remixing — people start from other builders' working systems. The dashboards leading the census above are not built once each by 151 people. A few proven dashboards get cloned and adapted hundreds of times. We unpack that behavior in the companion piece, The Remix Economy →.
Creation is still abundant — it is just private. Behind the public remix layer, the same 30 days saw 3,740 automations, 3,028 AI agents, and 295,284 AI generations. People generate constantly inside the systems they cloned.
🗂️ Per-Category Breakdown: What Each Build Actually Does
Behind the headline 28.2%, the census is a map of operational work. Each category is a system a business runs daily — and, not coincidentally, each maps to something people already search for ("ai dashboard builder," "portfolio maker," "ai schedule maker").
| Category | In plain English | Real-world build |
|---|---|---|
| Dashboards & analytics (28.2%) | Live status boards | Revenue, pipeline, KPIs, ops metrics in one view |
| Calculators & tools (12.9%) | Embedded utilities | Pricing, ROI, quoting, exam-score calculators |
| Booking & events (10.0%) | Intake & scheduling | Appointments, reservations, event registration |
| Education & learning (7.7%) | Course delivery | Training portals, lesson trackers, knowledge hubs |
| Project & task systems (5.6%) | Team coordination | Trackers, boards, status reports |
| Websites & portals (5.1%) | The operational front-end | Client portals, branded sites with a back-office |
| E-commerce & inventory (5.0%) | Storefront & stock | Product catalogs, order and inventory tracking |
| Music & media (3.5%) | Content & delivery | Media libraries, playlists, content hubs |
| CRM, finance, HR, legal, logistics (16.1%) | Back-office operations | Pipelines, invoicing, people ops, compliance |
Two things jump out. First, dashboards and calculators together are 41% of traffic — people overwhelmingly want a number on a screen they can trust. Second, almost every one of these is a CRM, tracker, or portal a small business would otherwise stitch together from four disconnected tools. With AI, they build one connected system instead.
Here is what that looks like in practice — real apps people built and published to the Community Gallery:
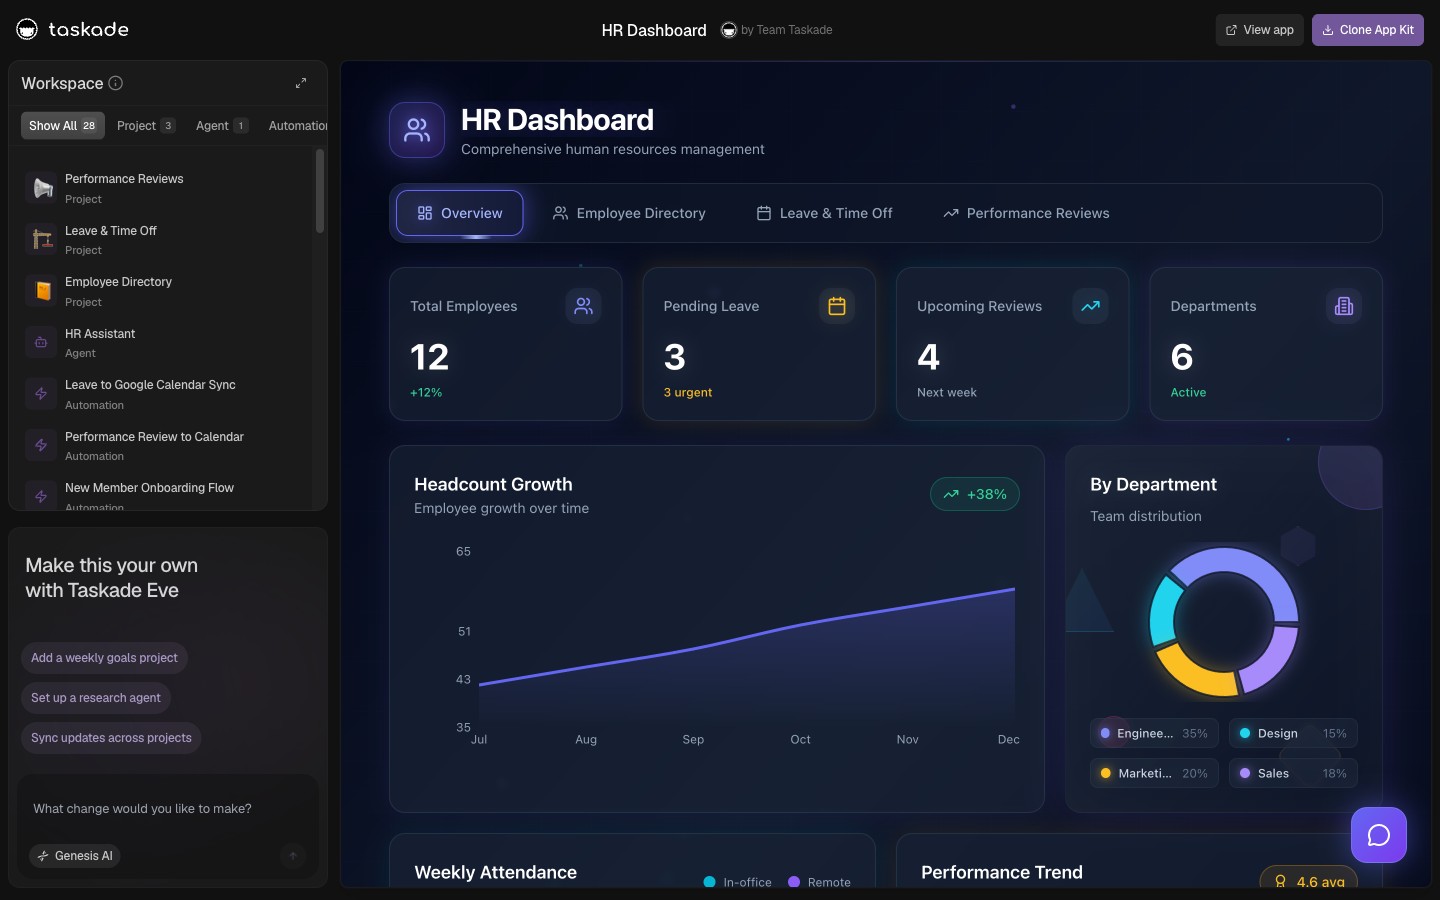
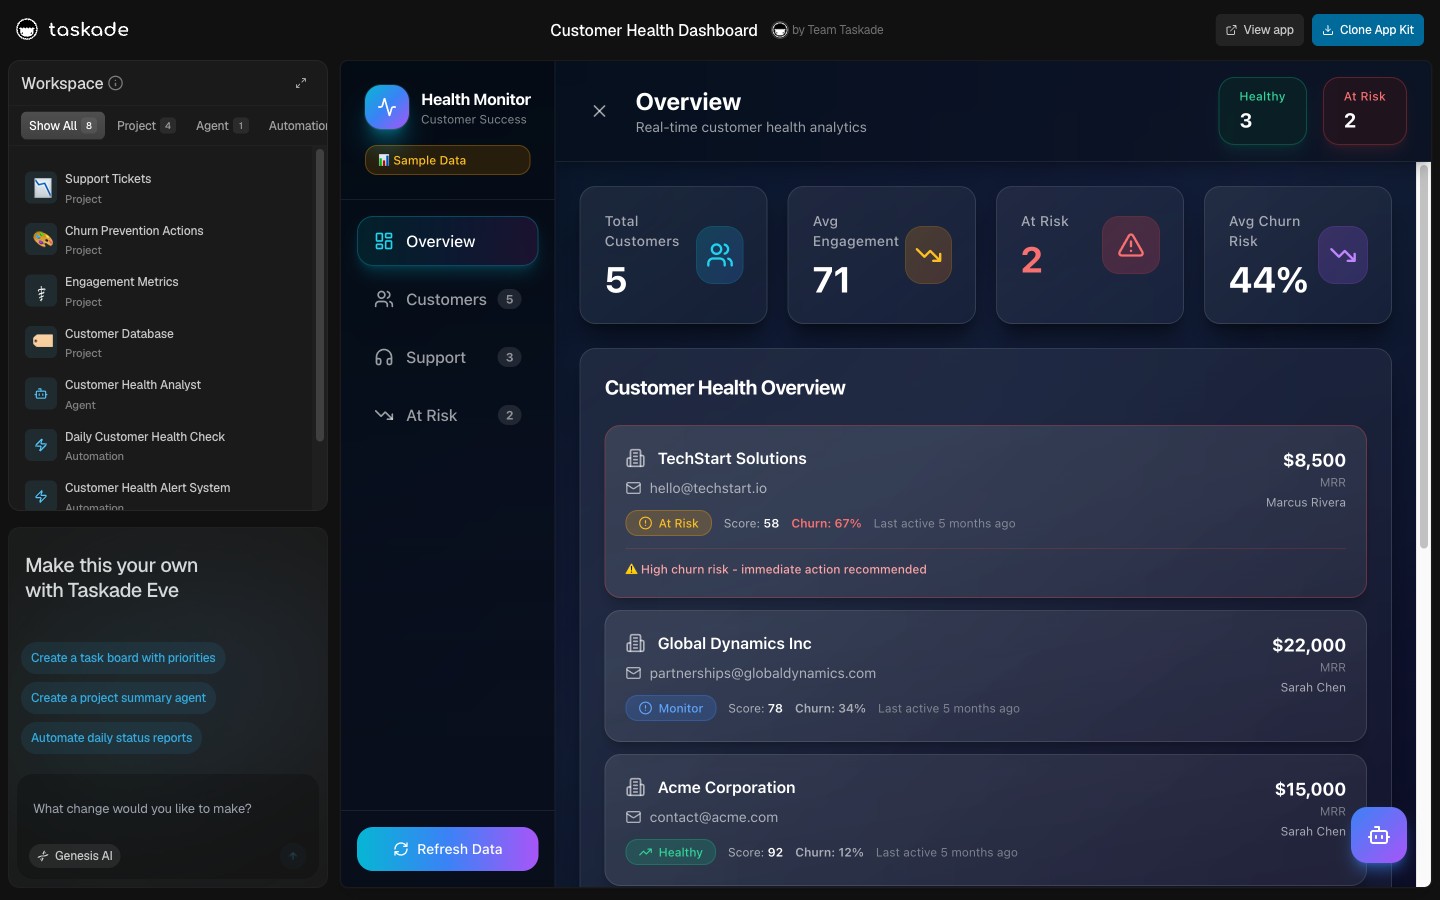
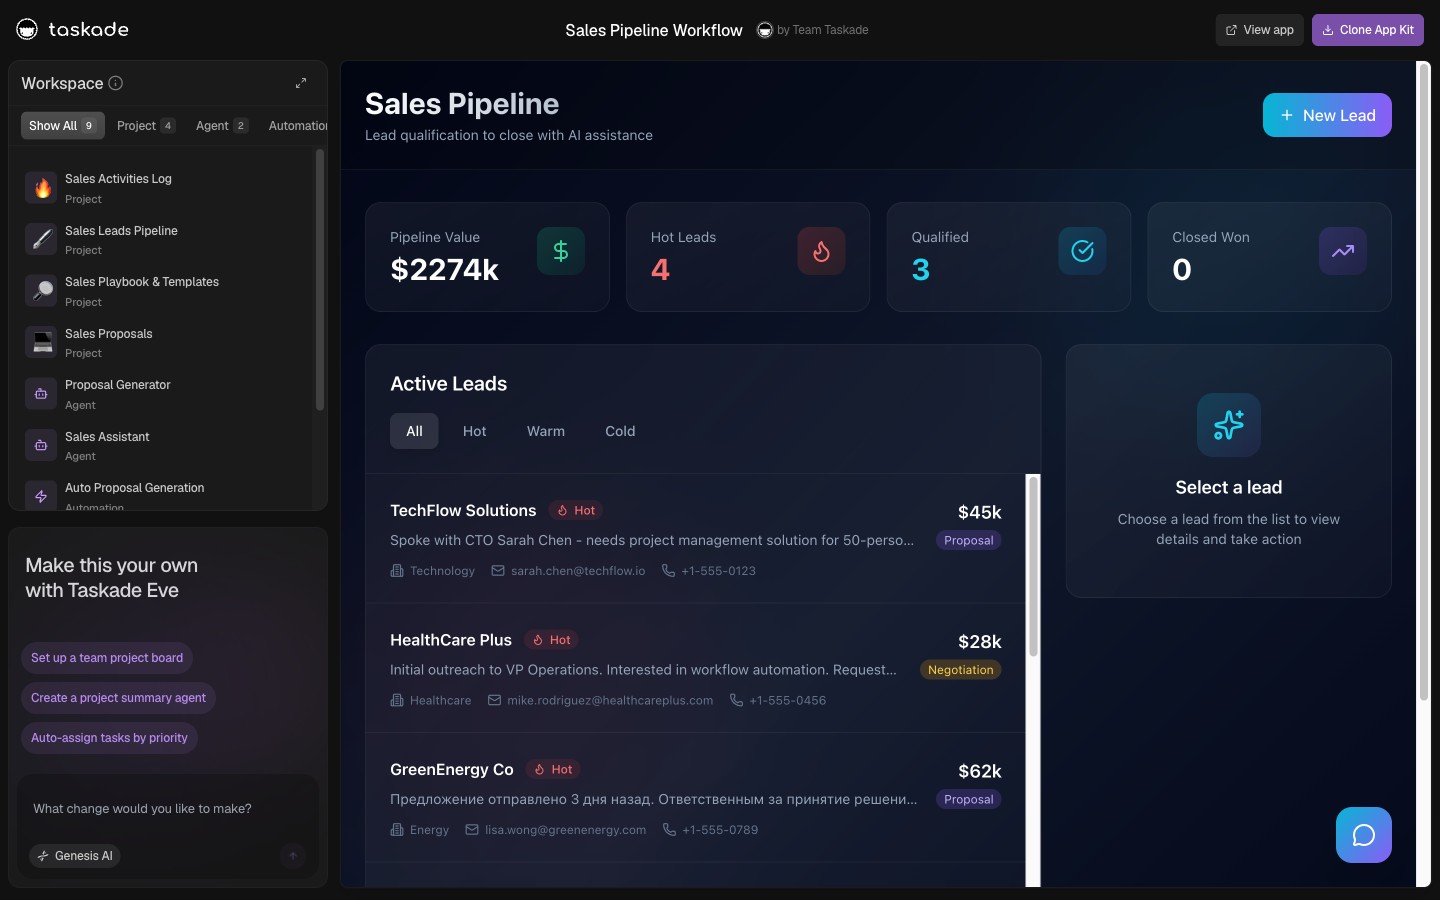
What does "connected" mean? A real Taskade Genesis app is not a single screen. It is multiple projects wired together — the kind of structure a field-service operator would describe as customers, jobs, invoices, and the team, all talking to each other:
That is why the average app holds 5.9 projects and 2.3 agents — most apps ship not with one agent but a small team of agents that hand work to each other, with automations that keep running on a schedule even when no one is watching. People are not building one screen. They are building a small operating system for their business.
🌐 How This Compares Across Platforms
Taskade Genesis is the only first-party dataset that reports what people operate. The other public datasets report what people publish, what they say, or how many projects exist — useful, but a different question:
| Source | Top category reported | What it tells you |
|---|---|---|
| Taskade Genesis (this census) | Dashboards & analytics — 28.2% | What people operate |
| Hostinger Horizons (Mar 2026, 1M users) | Business / portfolio sites — 49% | What people publish online |
| Lovable, The Build Economy (Jun 2026, self-reported) | Websites, CRMs, tools | What people say they build |
| Idea-listicles (ProjectPro, Google Cloud, etc.) | "101 things to build" | What people could build |
The census fits the broader market, too. Gartner forecasts the low-code market will reach about $44.5B by 2026, with developers outside formal IT making up 80% of low-code users. Lovable reports 50M+ projects (self-reported). The Anthropic Economic Index puts roughly 36% of AI-assistant usage in coding tasks. Every source points the same way once you look closely: building with AI is mainstream, and it is increasingly operational rather than experimental.
Even the code-first tools corroborate the shape. When Vercel rebuilt v0, it framed the effort around what it called the "90% problem" — the reality that the overwhelming majority of real software work is changing and extending systems that already exist, not generating new ones from scratch. That is the remix economy in a competitor's own words. And Base44, another AI app builder, describes its own outputs as dashboards, internal tools, client portals, and CRMs — almost the exact census you see above. The category keeps independently arriving at the same answer: people operate systems, they do not ship demos.
🎯 What This Means If You're Building With AI
The takeaway is not "build from scratch, faster." It is start from something that already runs. The data says the highest-leverage move is to clone a proven operational system — a dashboard, tracker, or portal — adapt it to your business, and let it become a system others remix in turn.
So if you are staring at a blank prompt wondering what to build: don't invent a category. Build the dashboard, CRM, or tracker your business already needs — the one currently living across four spreadsheets. That is what the people getting value from AI are actually building.
🛠️ Build Your System in Taskade Genesis
Taskade Genesis turns a plain-language description into a working operational app — not a prototype you still have to host. Connected projects become your data, AI agents do the work, and automations keep it running. You see the same data seven ways (list, board, calendar, table, mind map, Gantt, org chart), agents carry 34 built-in tools across 15+ auto-routed frontier models, and apps connect to 100+ services in both directions. Give clients a login on your own domain, lock a page behind a password, or publish to the gallery for anyone to clone.
| Capability | What you can do | Plan |
|---|---|---|
| Prompt → living app | Describe a system, get a working app — data, agents, automations, and a shareable interface — in minutes, no hosting | Free to start |
| Workspace DNA | Your projects (memory) teach your agents (intelligence) that run your automations (execution) — a system that compounds as you use it | Free+ |
| 7 project views | See the same data as a list, board, calendar, table, mind map, Gantt, or org chart | Free+ |
| AI agents + 34 tools | Agents search the web, read files, call APIs, run slash commands, and remember context | Pro+ |
| 15+ models, auto-routed | Each task goes to the right frontier model — no model picking, no code | Free+ |
| 100+ integrations | Slack, Gmail, Sheets, Notion, Stripe and more — triggers pull events in, actions push results out | Pro+ |
| Multi-agent teams | Hand work between specialized agents that collaborate on a job instead of one agent doing everything | Pro+ |
| Custom domain + client sign-in | Your own web address and a per-client login that shows only their data — no auth code | Business+ |
| Community Gallery | Clone any public app to start fast, or publish yours as public, secret, or private | Free+ |
Don't start with a blank canvas. Browse what people have already built in the Community Gallery, clone the closest fit, and make it yours.
🔬 How We Measured This (Scope & Honest Limits)
This is first-party usage data scoped specifically to 471 top-traffic paid published Taskade Genesis apps — not all AI apps, and not a representative survey of the market. The specifics:
- Scope. The category census reflects the 471 top-traffic paid Taskade Genesis apps, categorized by their projects and agent names. The clone-and-publish ratios reflect a separate 30-day window of platform usage.
- Skew (on purpose). Paid, top-traffic apps skew toward serious operators — which is exactly the population worth studying — but they do not represent every hobby app or free-tier experiment.
- What we withhold. No revenue, no individual app names, no trend lines. The value here is the shape of what people build, not a leaderboard.
Scoped honestly, the shape is unambiguous: people build operational systems with AI, dashboards lead, and they get there by remixing what already works.
📚 Sources & Methodology
Taskade Genesis first-party data. The category census covers 471 top-traffic paid published Taskade Genesis apps, categorized by their projects and agents (2,778 projects and 1,078 agents in total; averages of 5.9 and 2.3 per app; 211 published to the Community Gallery). The clone-and-publish figures (8,042 versus 60 events; 4,599 versus 49 users) come from a separate 30-day window of event telemetry. This is behavioral usage data — not a survey, and not a claim about all AI apps. Revenue, individual app names, and trend lines are withheld.
Third-party figures are attributed to their publishers and cited by name only (we do not pass links to commercial sources): Hostinger Horizons (Mar 2026, one million users); Lovable, The Build Economy (Jun 2026, self-reported); Gartner low-code forecasts (2022); Retool build-vs-buy survey (Feb 2026, n=817); Anthropic Economic Index (2026).
Methodology last reviewed June 12, 2026.
🔗 Related Reading
- The Remix Economy: How People Build Software With AI → — the behavioral data behind the census
- The State of Vibe Coding 2026 — the market numbers
- What Is Vibe Coding? — the explainer
- The Best Free AI App Builders — the tool roundup
- The Vibe-Coded Business — running a company on AI-built apps
- Vibe Coding for Non-Developers — who this is for
- Build it: Taskade Genesis · AI Apps · AI Agents · Automations · Templates · Community Gallery
💬 Frequently Asked Questions
What do people actually build with AI app builders?
Operational business systems. In a first-party census of 471 top-traffic paid Taskade Genesis apps, the largest category is dashboards and analytics at 28.2%, followed by calculators and tools (12.9%), booking and scheduling (10.0%), and education (7.7%). People build the systems a business runs on, not toys.
What is the most common type of app built with AI?
Dashboards. Across 471 top-traffic paid Taskade Genesis apps, dashboards and analytics tools are the single largest category at 28.2% of traffic (151 apps). These are live status boards for revenue, pipeline, operations, and KPIs — not single-screen demos.
Are AI-built apps just toys and demos?
No. The 471 apps in this census hold 2,778 connected projects and 1,078 AI agents combined, averaging 5.9 projects and 2.3 agents per app. These are multi-part operational systems a business runs daily.
What do people build with AI versus website builders?
AI workspace builders skew toward operational systems; website builders skew toward pages. Hostinger Horizons reported 49% business or portfolio websites and only 5% SaaS dashboards, while Taskade Genesis data shows dashboards at 28.2%. Websites are the front door; systems are the building behind it.
How was this AI app census measured?
It is first-party usage data scoped to 471 top-traffic paid published Taskade Genesis apps, categorized by their projects and agents. It is not a representative survey of all AI apps. The clone-and-publish behavioral data covers a separate 30-day window.
Do people build apps from scratch or clone existing ones?
They overwhelmingly clone. In a 30-day window, Taskade Genesis logged 8,042 clone events versus 60 new app publishes — roughly 134:1. People start from a proven system and adapt it rather than building from a blank prompt.
Can non-developers build business apps with AI?
Yes, and most builders are non-developers. Gartner projects developers outside formal IT will make up 80% of low-code users by 2026, and Retool found 35% of teams have replaced at least one SaaS tool with a custom build. AI app builders like Taskade Genesis turn a plain-language prompt into a working app.
What can you build with Taskade Genesis?
Dashboards, CRMs, client portals, booking systems, trackers, calculators, and internal tools — each with connected projects, AI agents, and automations. Taskade Genesis runs on 15+ frontier models with 100+ integrations and starts free.
▲ ■ ● What people build with AI is not toys — it is the dashboards, trackers, and portals that run a business. Connected Projects feed Intelligence, Intelligence triggers Execution, Execution creates Memory. Build the system your business already needs →.