


There are two types of companies — those that have mastered process mapping, and those about to learn. Process mapping isn't just a business buzzword; it's the cornerstone of business operations. It's about understanding how a company works at a fundamental level and finding ways to do things better.
In this article, we're diving deep into what process mapping is, why it matters, and how you can use it to give your business or team a competitive advantage.
TL;DR: Process mapping visually documents how work flows through your organization, revealing bottlenecks and waste that text descriptions miss. Organizations that map processes consistently find 20-30% efficiency gains. Use Taskade's Mind Map view to create process maps with AI, then convert nodes into actionable tasks. Try Taskade free →
🔎 Dive deeper... Make sure to check our article 🔄 What Are SOPs? when you're done reading.
📐 What Is Process Mapping?

Every process or task, no matter how simple, breaks down into sequential steps.
Onboarding a client? Make contact, gather info, and set up accounts.
Managing projects? Define goals, plan tasks, assign roles, and track progress.
Writing a short story? Come up with an ideas, outline, draft, and edit.
But describing things with words isn’t always the most optimal way to explain the nitty-gritty. Especially when you’re dealing with complex, multi-layered processes.
A 20th century engineers Frank and Lillian Gilbreth came to a similar conclusion when they introduced the “Flow Process Chart” to the American Society of Mechanical Engineers in 1921.
Modern process mapping is a visual tool designed to outline the flow of activities and show how each step leads to the next. To achieve that, process maps use sets of symbols and arrows to depict the sequence and visualize decision points and pathways.
🚥 Types of Process Maps
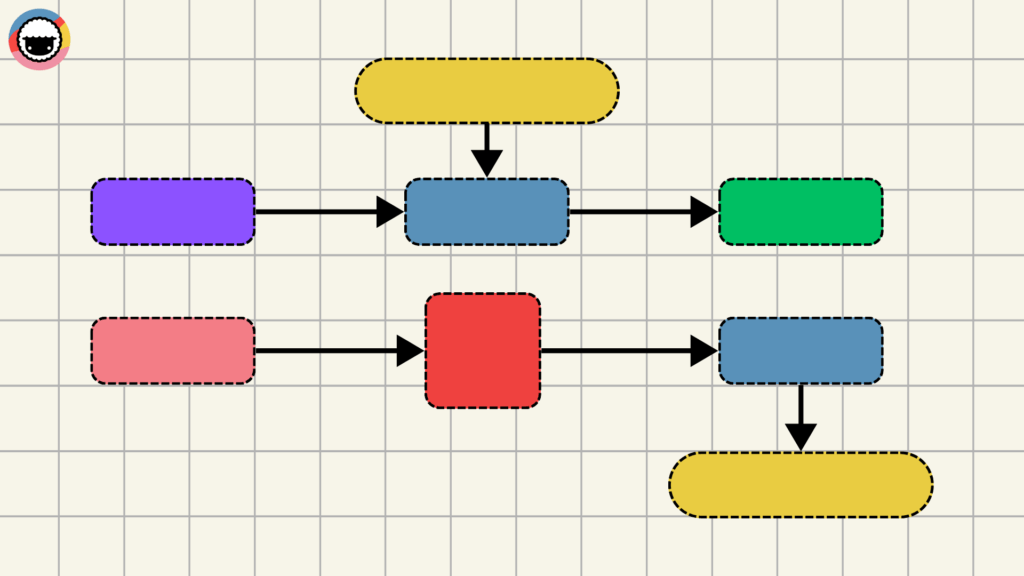
Flowcharts
The American Society for Quality (ASQ) defines a flowchart as: “(...) a picture of the separate steps of a process in sequential order.” Simple and unassuming? Absolutely. But process flowcharts also happen to be one of the most powerful business tools around.
During WWII, flowcharts were used for mapping manufacturing, logistics, and operation planning. But it wasn’t until the late 1940s when they took their modern form.
Seventy years on, flowcharts haven't lost their edge. They are used across all kinds of industries and organizations — from tech startups to healthcare.
Here’s where they’re making the biggest impact:
| Project Management | Organize project phases, clarify roles, and sequence tasks. |
|---|---|
| Troubleshooting Guides | Provide step-by-step solutions for resolving common issues. |
| Process Improvement | Identify bottlenecks and opportunities to enhancing the flow. |
| Employee Training | Simplify procedures to help new hires understand them a glance. |
| Software Development | Visualize program structures and decision branches. |
Swimlane Diagrams
Imagine you're mapping an airport operation.
A flowchart would present a linear, step-by-step journey of a passenger, like arriving, checking in, passing through security, and boarding, but without specifying who handles each step.
In a swimlane diagram, you'd see separate lanes for security, check-in, ground staff, and flight crew.
While swimlane diagrams share structural similarities with traditional flowcharts, they add one more layer that highlights responsibilities across different teams or departments.
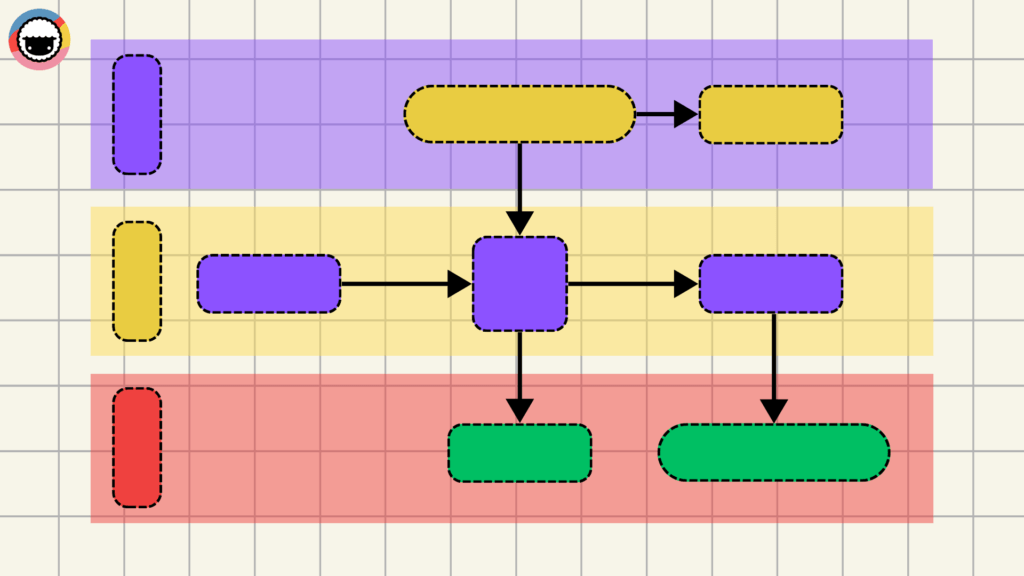
Swimlane diagrams mirror traditional flowcharts in structure, with one key difference. They introduce an additional layer that highlights responsibilities across teams or departments.
This extra dose of granularity makes swimlane diagrams perfect for:
| Business Process Analysis | Identify inefficiencies and communication gaps. |
|---|---|
| Workflow Improvement | Highlight bottlenecks in organizational processes. |
| Onboarding and Training | Simplify training by clarifying responsibilities for new hires. |
| Customer Service Optimization | Map customer journeys for improved customer experiences. |
| Compliance and Regulation | Ensure adherence to legal and regulatory requirements. |
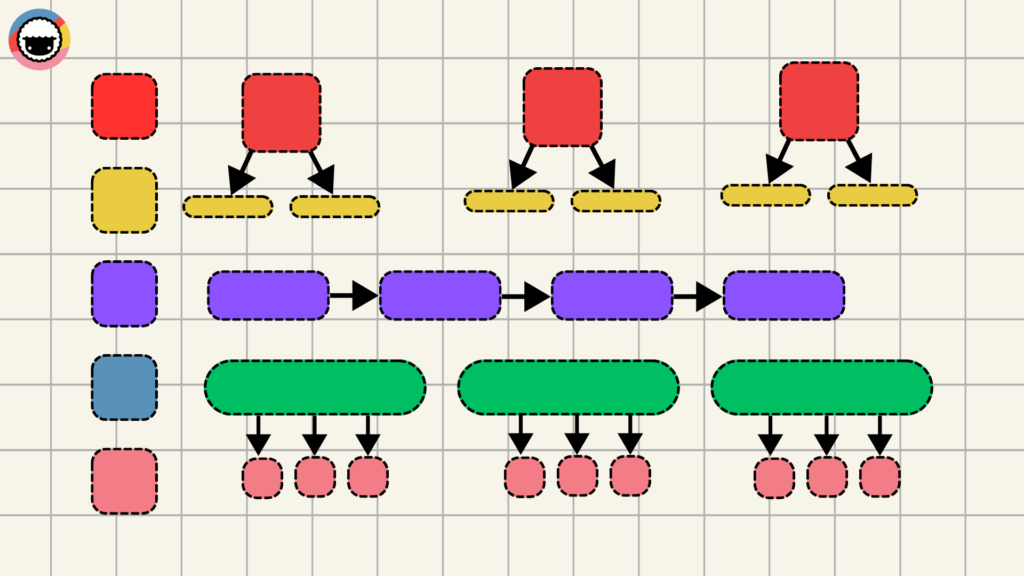
Value Stream Mapping
Value Stream Mapping (VSM) is a lean-management method used to analyze the flow of materials and information. It's used in lean management to efficiently deliver a product or service to the customer.
For instance, a company manufacturing electronics may use value stream mapping to visualize the entire production process — from sourcing components to assembling the products and shipping them out. This, for example, may help discover that certain parts spend days waiting in inventory.

A value stream helps you see where things slow down, where they could speed up, and where you might be adding steps you don’t need. It's the right tool for:
| Process Efficiency Analysis | Identify and eliminate non-value-adding activities. |
|---|---|
| Customer Value Alignment | Ensure that business processes align with customer needs. |
| End-to-End Process Visualization | Track the entire process, from raw material to final products. |
| Bottleneck Identification | Address bottlenecks that hinder process flow. |
| Cross-Functional Collaboration | Foster teamwork across different business areas. |
SIPOC Diagrams
Alright, let's dive into SIPOC Diagrams. Think of SIPOC — an acronym for Suppliers, Inputs, Process, Outputs, and Customers — as your business’s magnifying glass.
SIPOC dissects each element of your workflow so you can zoom in on the specifics like who's supplying what, the inputs feeding into the processes, steps involved, and who's on the receiving end.
Unlike flowcharts, SIPOC diagrams focus on the core components of a process rather than drilling down into incremental steps or decisions. They are sometimes referred to as COPIS diagrams to emphasize the importance of customers in the process.
Now, let's take a look where SIPOC diagrams shine:
| High-Level Process Mapping | Quickly map out a process at a high level. |
|---|---|
| Stakeholder Identification | Identify and document key stakeholders and their roles. |
| Defining Process Boundaries | Establish the start and end points of a process. |
| Enhancing Team Communication | Simplify communication in cross-functional teams. |
| Supporting Root Cause Analysis | Uncover the origins of process issues. |
🔎 Benefits of Process Mapping
So, why would you choose workflow diagrams instead of, you know, good’ol text?
Let’s start with the science end of things.
Studies have shown that visual information is processed 60,000 times faster than text. It’s also easier to remember than text alone. This comes with a number of compelling benefits.
Since process maps are a visual-first tool, they're an excellent medium for conveying complex information. They offer a clear picture (pun not intended) of how things work which, in turn, helps identify any bottlenecks and find opportunities for process optimization.
Universal process mapping symbols (we’ll get to that in a moment) play a part too. They're like the emojis of the business world, instantly recognizable and cutting through language barriers. This visual shorthand means faster onboarding for new team members and fewer "lost in translation" moments.
The stress on visual information also impacts cross-functional collaboration. It bridges the gap between teams and departments that tend to suffer from information silos full of jargon and process creep.
Finally, process map help with knowledge preservation.
People come and go. They contribute to a process, document it (in the ideal world), and move on. But the process documentation that stays behind is often obscure, leading more to questions than answers.
A good process map sticks around. It ensures a smooth transfer of information, making it easier for successors to pick up where the previous team left off, without losing context.
Process Map Types at a Glance
| Map Type | Best For | Complexity | Taskade View |
|---|---|---|---|
| Flowchart | Simple sequential processes | Low | Mind Map |
| Swimlane Diagram | Cross-functional workflows | Medium | Board + Org Chart |
| Value Stream Map | Lean optimization | High | Table + Timeline |
| SIPOC Diagram | High-level process overview | Low | List + Table |
| AI-Generated Map | Any process — describe it, AI builds it | Low (AI handles complexity) | All 7 views |
Taskade lets you map processes in Mind Map view, then instantly switch to Board, Gantt, or Timeline view without recreating your data. Deploy AI agents to generate process documentation from descriptions, and connect 100+ integrations to trigger automated workflows from your process maps.
🏗️ How to Create a Process Map
Your approach to mapping a process will differ depending on the industry, format, and organizational culture. But the general steps are quite universal, so let’s break it all down into three steps:
Define the Scope
Start by defining the boundaries of the process you want to map.
"What are the specific goals of this process?"
"Who are the key stakeholders involved?"
"What are the critical inputs and outputs?"
"What are the potential bottlenecks or pain points?"
"What resources are required for successful execution?"
Those questions will help you determine the starting point, ending point, and the level of detail you need. They will help you focus on the relevant parts of the process without getting overwhelmed.
Gather Information From the Field
Unless you’re the sole stakeholder in the process, you need to do some research.
This may involve interviewing employees who are directly involved in the process, reviewing existing documentation, or observing the process in action. But it doesn’t end there:
Gather quantitative data on process efficiency.
Solicit direct feedback from customers or clients.
Identify bottlenecks and inefficiencies.
Review feedback and suggestions from front-line employees.
Analyze historical performance trends.
Make sure to understand each step, who is responsible, and how the steps are interconnected before you move on. You’ll save a ton of time on back-and-forths down the road.
Draw the Process Map
Now, we're at the heart of it.
Think of each step in your process like a piece of jigsaw puzzle. Your task? Lay them out, one by one, in the precise sequence they unfold, and visualize how they're interconnected.
As you map out the process, consider the dependencies between steps. Some actions can’t happen until others are completed. This interconnectivity is a vital part of your process map.
Pick a consistent visual convention, and stick with it. A process map is most effective when it uses standardized symbols — shapes, colors, lines, and labels — to avoid confusion.
Finally, make each step as clear and unambiguous as possible. This is not just about listing actions; it’s about getting a good grasp of their purpose and impact within the larger process.
Don't want to start from scratch?
Use Taskade's 🤖 Workflow Generator and the 🌳 Mind Map / Flowchart view to quickly generate a a process map with the power of AI. Simply describe your process and let Taskade handle the rest.
Create flows, mind maps, and more with Taskade AI 🐑
Of course, your work doesn’t end there. You should regularly validate and update your maps as the process evolves with time. Team feedback is invaluable and will help you iterate and improve the steps.
When you’re done, share the map with all relevant stakeholders. You may also want to involve the people affected by the process to make sure nothing slips through the cracks.
☝️ Challenges and Best Practices
Need more help? Run into problems? We put together a handful of extra tips & tricks that will help you avoid common mistakes and make the most of your process maps.
❌ Problem: "My process maps are too complex."
- ✅ Solutions:
Focus on key steps: Look at each step and ask, “Does this directly contribute to achieving our core objectives?” If a step isn’t essential for meeting your goals, remove it.
Apply the 80/20 rule: Often, 80% of outcomes come from 20% of actions. Identify those 20% of steps that yield the most significant results and prioritize them.
❌ Problem: "I can’t get my team on board."
- ✅ Solutions:
Signal the benefits: Clearly communicate how the process changes will make each team member's job easier and more efficient. Personalize benefits to increase buy-in.
Involve the team: Start with a bottom-up approach. Include team members in the planning and development stages to build a sense of ownership.
❌ Problem: "I lack expertise."
- ✅ Solutions:
Encourage knowledge sharing: Create opportunities for team members to share knowledge and experiences. Peer-to-peer learning can be a powerful tool.
Mentorship programs: Pair less experienced team members with mentors who can guide their development and share valuable insights from their own experiences.
❌ Problem: "My process maps are not consistent."
- ✅ Solutions:
Develop clear guidelines: Create detailed guidelines and standard operating procedures (SOPs) for each task. Make them easy to digest and apply.
Standardize visual elements: Implement clear, universally recognized symbols. These should communicate effectively across teams and departments.
Workspace DNA: From Static Diagrams to Self-Updating Process Intelligence
Process maps are only useful if they stay current — and most don't. Workspace DNA solves this with a self-reinforcing loop of Memory, Intelligence, and Execution. Memory (Projects) stores every process map, SOP, flowchart revision, and workflow change log in a persistent knowledge base that preserves institutional knowledge even as team members rotate. Intelligence (AI agents with 34 built-in tools) analyzes process execution data to surface bottlenecks, flag steps that consistently cause delays, and recommend optimizations based on patterns across your entire process library. Execution (Automations) transforms process maps into living workflows — triggering handoffs, routing approvals, and syncing updates across 100+ integrations so your documented processes actually run automatically.
The compounding effect matters. Each process revision enriches the knowledge base. Agents learn which process changes actually improved throughput and which created new bottlenecks. Over time, your process maps evolve from static documentation into adaptive systems that optimize themselves. Learn more about Workspace DNA and living software.
Vibe Coding for Process Mapping: Describe Your Workflow, Deploy It Instantly
Vibe coding — building software by describing what you want in natural language — eliminates the gap between documenting a process and automating it. Describe your workflow to Taskade Genesis and it builds a live process management app: approval routing systems, onboarding checklists with automated handoffs, compliance tracking dashboards, or cross-departmental swimlane workflows. With 150,000+ apps already built this way, teams are replacing static Visio diagrams with interactive, AI-powered process tools.
Deploy AI agents powered by frontier models from OpenAI, Anthropic, and Google to generate process documentation from plain-English descriptions, identify redundant steps in existing workflows, and monitor process adherence in real time. Combine Mind Map view for brainstorming with Gantt and Timeline views for execution tracking — all 7 project views work seamlessly with 7-tier role-based access control and automations backed by durable execution. Explore ready-made process mapping templates in the Community Gallery or start building for free, with Pro from $10/mo billed annually.
Agentic AI: Autonomous Process Discovery and Optimization
Agentic AI revolutionizes process mapping by automating both discovery and optimization. Instead of interviewing stakeholders and manually drawing flowcharts, autonomous AI agents with 34 built-in tools and persistent memory observe how work actually flows through your organization — tracking task handoffs, measuring step durations, and identifying undocumented workarounds. Agents then generate accurate process maps that reflect reality, not idealized procedures. Deploy a Process Discoverer agent that maps actual workflows, an Optimization Agent that identifies waste and suggests improvements, or a Compliance Monitor agent that flags deviations from standard operating procedures. Build custom process management systems with Taskade Genesis — it's vibe coding for workflow design. Explore the Community Gallery or browse 500+ templates.
Process Mapping Maturity: Static to AI-Optimized
| Maturity Level | Approach | Update Frequency | Taskade Feature |
|---|---|---|---|
| Level 1: Manual | Hand-drawn or Visio diagrams | Rarely updated | Mind Map view |
| Level 2: Collaborative | Real-time team mapping | After major changes | Real-time editing + 7 views |
| Level 3: AI-Assisted | AI generates maps from descriptions | On demand | AI Workflow Generator |
| Level 4: AI-Managed | AI monitors and updates processes | Continuous | AI agents with persistent memory |
| Level 5: Living System | Process maps ARE the execution layer | Real-time | Taskade Genesis + Automations |
Frequently Asked Questions
What is process mapping and why is it important?
Process mapping is the visual documentation of how work flows through an organization — capturing every step, decision point, handoff, and outcome in a business process. It's important because it makes invisible workflows visible, revealing bottlenecks, redundancies, and waste that are impossible to see when processes exist only in people's heads. Organizations that map their processes consistently find 20-30% efficiency improvements through elimination of unnecessary steps.
What are the different types of process maps?
Common types include: flowcharts (linear step-by-step diagrams), swimlane diagrams (showing responsibilities across departments), value stream maps (tracking value-add vs. waste across a process), SIPOC diagrams (Suppliers, Inputs, Process, Outputs, Customers), and BPMN (Business Process Model and Notation for technical process documentation). Choose flowcharts for simple processes, swimlanes for cross-functional workflows, and value stream maps for Lean optimization initiatives.
How do you create a process map?
Create a process map in five steps: 1) Define the process scope (start and end points), 2) Identify all steps by walking through the process with people who actually do the work, 3) Document decision points, inputs, outputs, and handoffs, 4) Arrange steps in sequence using standard flowchart symbols, 5) Validate the map with stakeholders and identify improvement opportunities. Tools like Taskade's Mind Map view let teams collaboratively map processes in real time.
What tools help with process mapping?
Process mapping tools include Taskade (real-time collaborative Mind Maps with AI agents that can generate process documentation), Lucidchart (dedicated diagramming), Miro (visual collaboration whiteboard), Microsoft Visio (enterprise diagramming), and draw.io (free open-source diagrams). Taskade differentiates by combining process mapping with task management — you can map a process in Mind Map view, then convert nodes directly into actionable tasks with assignments and deadlines.
How does Taskade Genesis help with process mapping and workflow design?
Taskade Genesis lets teams build custom process mapping and workflow automation apps from a single prompt. With 150,000+ apps already created, teams generate interactive flowchart builders, swimlane diagram tools, and process optimization dashboards that deploy instantly with custom domains. Visit taskade.com/ai/apps to explore ready-made process tools or build your own.
What is vibe coding and how does it apply to process mapping?
Vibe coding means building software by describing what you want in natural language rather than writing code. For process mapping, teams describe their workflow — such as a customer onboarding process with approval gates — and Taskade Genesis builds it as a live, interactive process map with embedded AI agents that monitor execution. This replaces static diagrams with living, executable process documentation.
How do AI agents automate process documentation and optimization?
Taskade AI agents with 34 built-in tools and MCP connectors automate the entire process mapping lifecycle. Agents generate process maps from verbal descriptions, identify bottlenecks by analyzing task completion times, suggest optimization opportunities based on historical data, and keep documentation updated as processes evolve. With persistent memory, agents maintain an always-current view of how your organization actually works.
What is Workspace DNA and how does it improve process management?
Workspace DNA is Taskade's self-reinforcing loop of Memory, Intelligence, and Execution. Memory (Projects) stores process maps, execution logs, and performance metrics. Intelligence (AI agents) analyzes process data to identify inefficiencies and recommend improvements. Execution (Automations) turns process map nodes into triggered workflows across 100+ integrations. This loop transforms static process documentation into living, self-optimizing operational systems.
🐑 Wrapping Up: Power of Process Mapping in Business
Text is still king when it comes to explaining complex concepts. But throwing clear, consistent process maps into the mix will help translate those ideas into a universal language everybody can understand.
Here’s a few more takeaways from this article:
📏 Frank Gilbreth's 1921 Flow Process Chart set the stage for process mapping.
👁️ A process map is a visual tool used to represent steps in a process.
🚀 The primary benefit of process mapping is its ability to simplify complex processes.
🔀 There are many types of process maps including flowcharts and swimlane diagrams.
⭐ Process maps are key for clear business operations and team collaboration.
🤖 Generative AI workflows are the future of process mapping.
And that’s it! 🥳
Ready to streamline your processes?
Sign up and start building process maps with Taskade in seconds. 🐑
📖 Learn more: Ultimate Guide to Taskade Genesis | What Is Vibe Coding? | How Workspace DNA Works | AI Agents | Automations | Browse Templates | Community Gallery
