
Building dashboards typically requires data visualization tools, spreadsheet formulas, and design work. Taskade's AI Text to Dashboard Converter takes a different approach. Describe your metrics, KPIs, and tracking needs in plain text, and AI generates a functional dashboard with organized data views, status trackers, and team visibility. No spreadsheet formulas, no drag-and-drop widget builders, just describe what you want to track.
How to Convert Text to a Dashboard With Taskade
Go to the Taskade App Generator and describe the dashboard you need. Specify the metrics you want to track, data categories, team members responsible, and how you want information organized. The AI generates a structured dashboard with appropriate views and layouts tailored to your description.
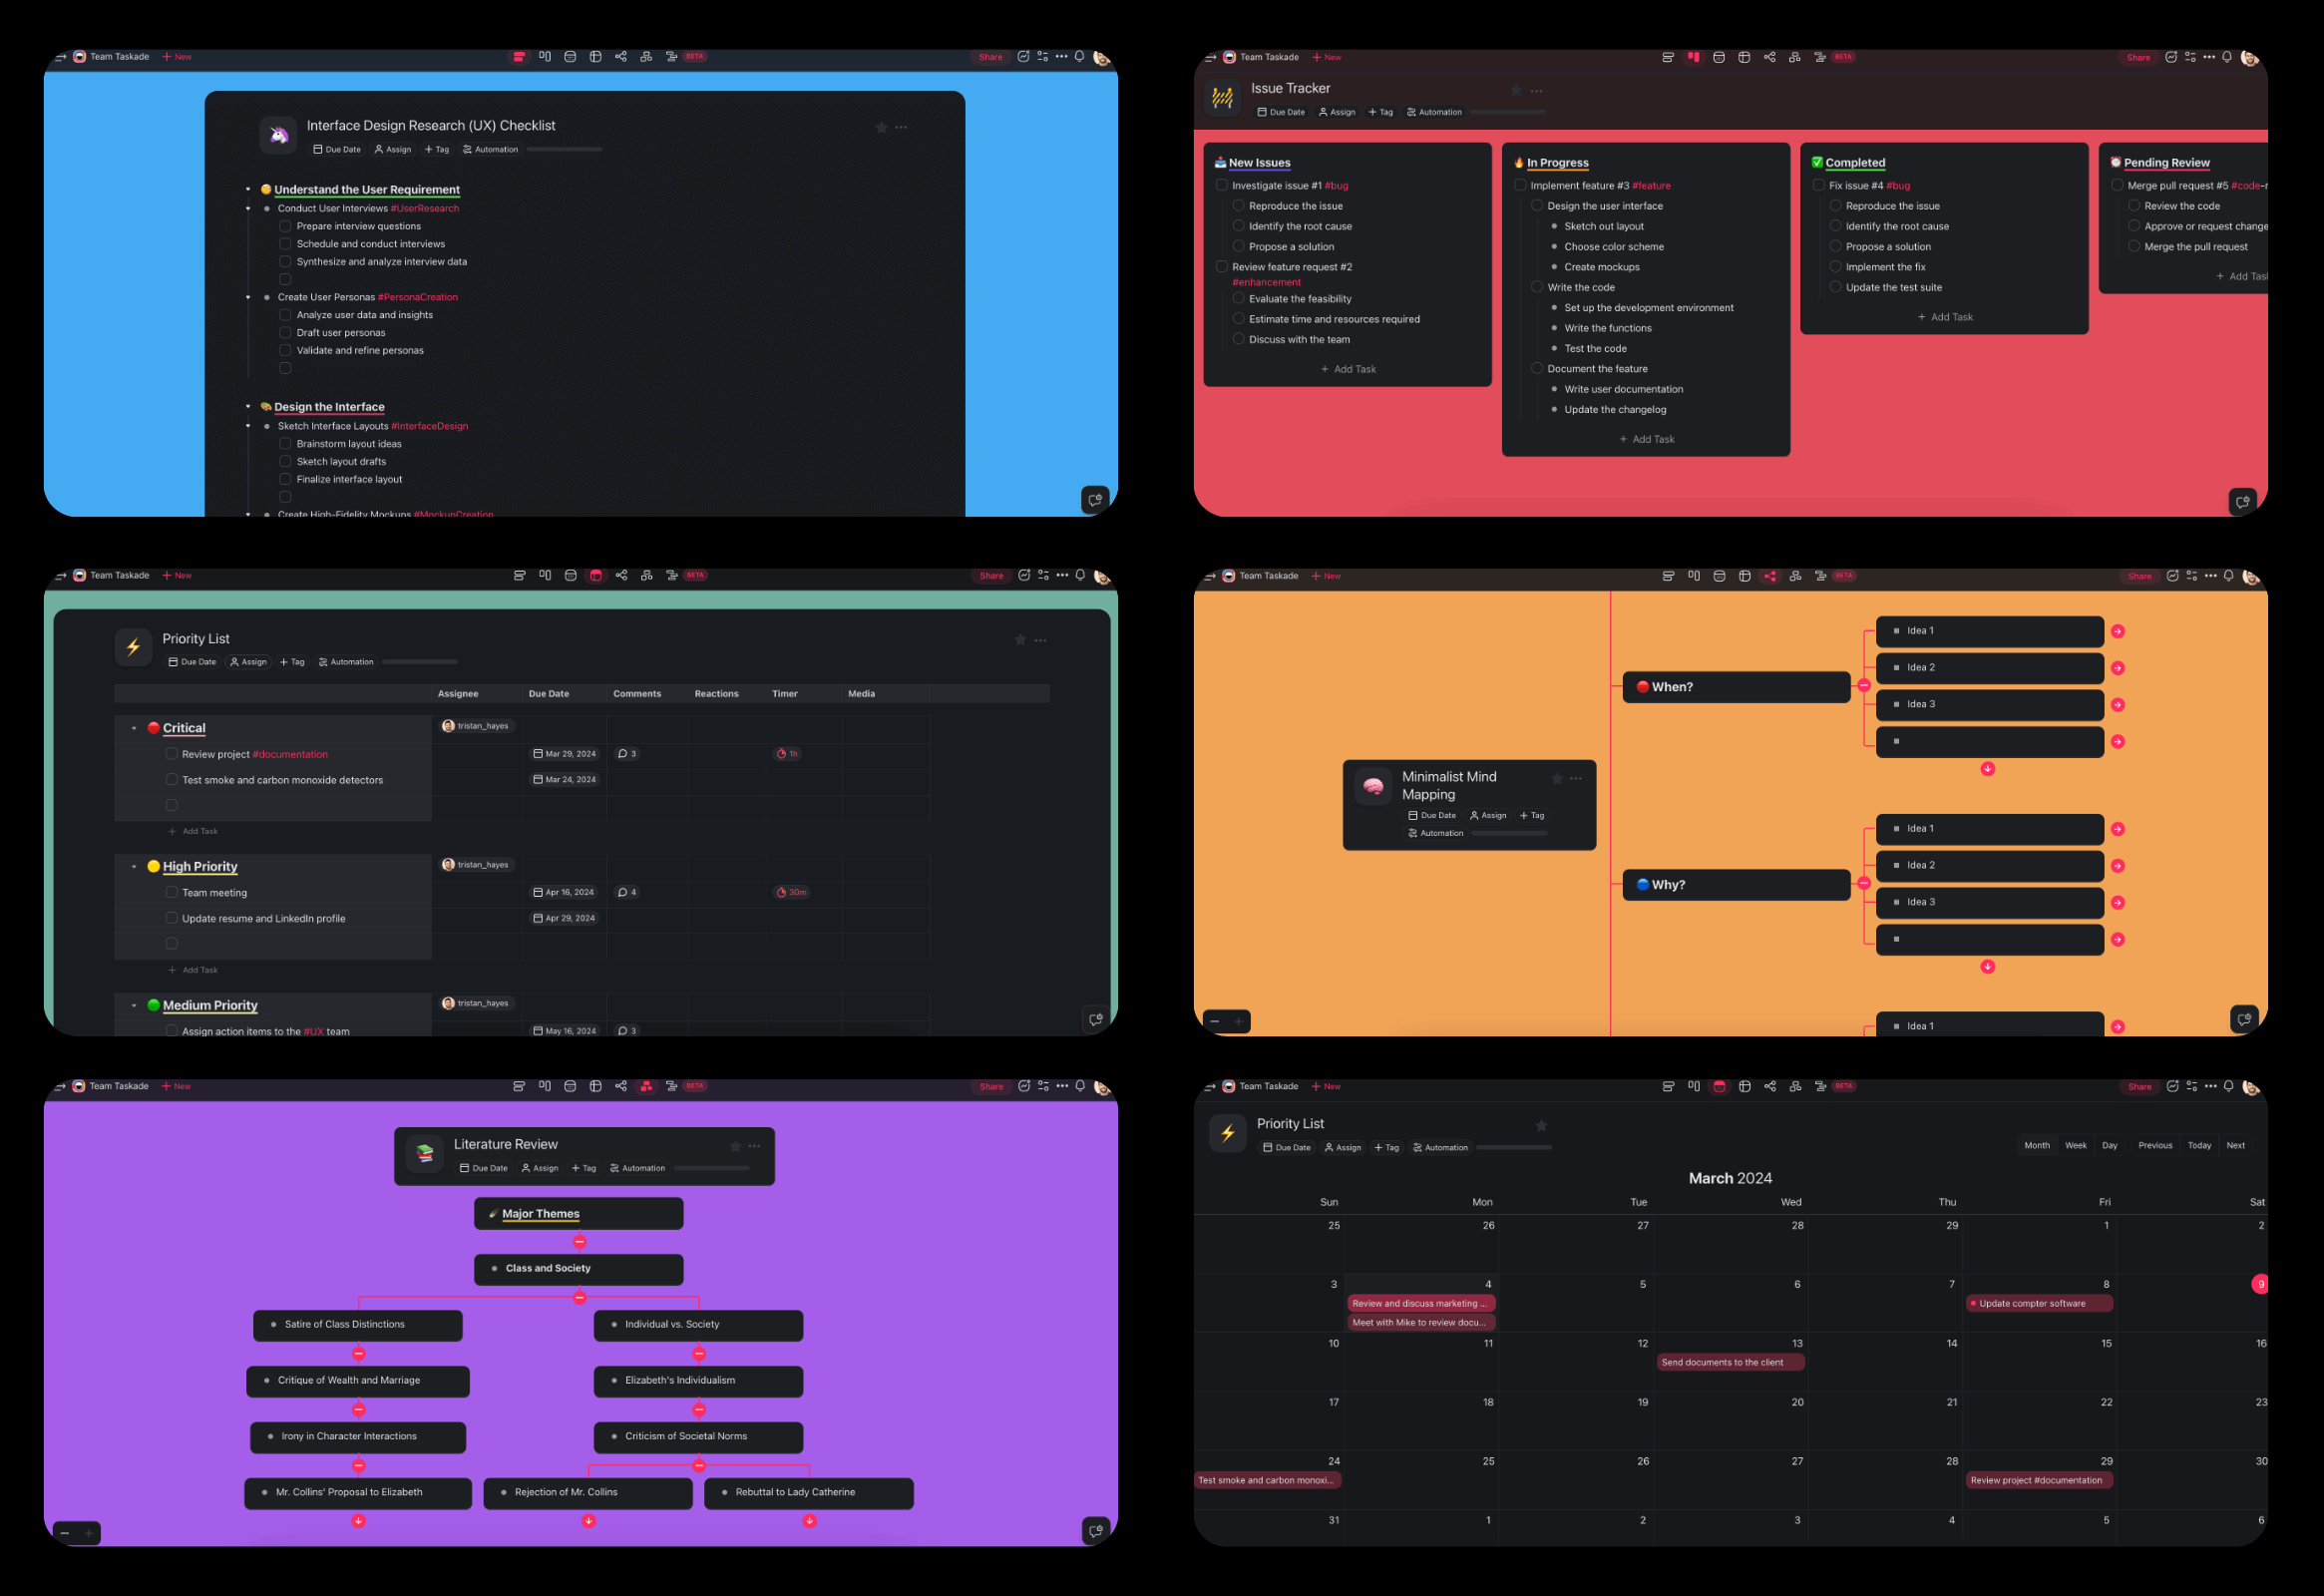
Use the AI Assistant to refine metrics, add calculated fields, and connect AI Agents for automated data updates. Switch between project views like Table for data grids with filtering and sorting, Board for visual status tracking with Kanban columns, Timeline for chronological trend analysis, and Gantt for deadline management.
Taskade supports 15+ frontier AI models from OpenAI, Anthropic, and Google. Collaborate on dashboards with your team using 7-tier permissions (Owner, Maintainer, Editor, Commenter, Collaborator, Participant, Viewer). Export dashboard data as Markdown, PDF, HTML, or JSON.
Use Cases
Sales Performance Dashboard
Describe your sales metrics: revenue targets, deal pipeline, conversion rates, and team performance. AI creates a dashboard with pipeline Board view showing deals by stage, metrics Table with sortable columns, and Timeline for trend tracking. AI Agents can flag deals at risk and send alerts to sales managers.
Project Status Dashboard
Describe your project portfolio and tracking needs. AI generates a multi-project dashboard showing deadlines, milestones, team assignments, and completion status across Gantt and Board views. Track dependencies between projects and identify bottlenecks.
Marketing Campaign Dashboard
Describe your campaign metrics: traffic, conversions, spend, and ROI by channel. AI builds a dashboard that organizes data by channel, campaign, and time period with Table view for detailed analysis. Board view groups campaigns by status: Planning, Active, Completed.
Team Productivity Dashboard
Describe your team's workflow and performance indicators. AI creates a dashboard tracking task completion rates, workload distribution, capacity utilization, and bottleneck identification. Managers can view team performance at a glance and assign work based on availability.
OKR Tracking Dashboard
Describe your quarterly objectives and key results. AI generates a dashboard that maps OKRs to team members, tracks progress percentages, and highlights objectives that need attention. Timeline view shows progress over the quarter.
Frequently Asked Questions
Can I create a dashboard from text for free?
Yes. Taskade's free tier includes AI-powered text to dashboard conversion. Describe your metrics and get a functional dashboard instantly. No credit card required and no feature limitations on the free plan.
Can I update dashboard data in real time?
Yes. Dashboard data is fully editable and collaborative. Team members can update metrics in real time, and AI Agents can automate data entry through workflow automation. Changes sync instantly across all connected devices.
Can I share the dashboard with stakeholders?
Yes. Share via link with specific permissions. Use Viewer permission for read-only access, Commenter for feedback, or Collaborator for interactive participation. 7-tier permissions give you precise control over who sees and edits what.
Can I automate dashboard updates?
Yes. Connect to workflow automation for scheduled data refreshes, automated status updates, and notification triggers when metrics hit thresholds you define.
How To Use This Converter
Go to Taskade App Generator.
Describe your dashboard: metrics, KPIs, categories, and layout preferences.
AI generates a structured dashboard with appropriate views.
Customize data fields, connect AI Agents, and invite your team.
Share via link or embed for stakeholder visibility.