


Every consulting firm on earth is writing the same essay right now. "AI will flatten the org chart. Middle management will compress. Agents will become teammates." Abstract, directionally correct, zero mechanism.
The AI-first companies that already did this did not write essays. They just drew different pictures.
What Is an AI Org Chart? Three Named Models on the SERP
The terminology is still fluid. Three competing frames are shaping the 2026 conversation — and they are not interchangeable.
| Model | Coined by | What it emphasizes |
|---|---|---|
| Work Chart | Inkeep (Jan 2026) | Replace the org chart with a map of workflows. Agents fit into the map. |
| Agentic Mesh | McKinsey (Apr 2026) | Agents as a mesh layer plugging into existing hierarchies. Governance-first. |
| Hierarchy → Intelligence | Sequoia Capital | Historical framing: Roman legions → Taylor → matrix → Holacracy → agentic. |
This post picks the Work Chart side of the debate — because the thing you actually need to draw on a whiteboard is a workflow map with named agents on it. Agentic Mesh is useful for governance conversations. Hierarchy → Intelligence is useful for boardroom storytelling. Work Chart is useful for Monday-morning rebuilds.
The Historical Lineage (Why This Keeps Happening)
Every era of business has had to redraw its org chart when the coordination technology underneath changed. The pattern:
┌─────────────────┬─────────────────────────────┬──────────────────────────┐
│  ERA            │  COORDINATION TECHNOLOGY    │  ORG CHART SHAPE          │
├─────────────────┼─────────────────────────────┼──────────────────────────┤
│  Roman army     │  Written orders + runners   │  Strict hierarchy         │
│  Industrial age │  Telegraph + timetables     │  Taylor's pyramid         │
│  Computer age   │  Spreadsheets + email       │  Matrix orgs              │
│  Internet age   │  Wiki + chat + video        │  Flat / Holacracy         │
│  **Agent age**  │  **Memory + Intelligence    │  **Workflow-first         │
│  (2023+)        │   + Execution in one canvas**│   Work Chart with        │
│                 │                             │   named agents**          │
└─────────────────┴─────────────────────────────┴──────────────────────────┘
Each era, the same thing: new coordination technology arrives, the old chart stops producing leverage, the early adopters redraw first, the laggards catch up after their competitors. Taskade Genesis is the coordination technology for the Agent age — Memory, Intelligence, Execution in one canvas — which is why the Work Chart version of the new org chart runs there cleanly.
TL;DR: AI-first companies stop drawing org charts of people and start drawing charts of work. Inputs flow left to right through named agents and automations toward outputs. Humans own Judge tasks; agents own Run tasks; automations own Route tasks. Headcount drops 3–5×; output rises 2–4×. Taskade Genesis is where the new chart actually runs — because the chart and the running company are now the same artifact.
This is the second companion post to the Win With AI in 2026 pillar. Read that one for the full frame. Read this one for the literal drawing.
The Old Org Chart (Role-First)
Here is what almost every company's chart still looks like in April 2026.
Seventeen boxes. Four layers. The chart tells you who reports to whom. It tells you nothing about what the business actually does. If every box went home for a week, the chart would look identical and the business would produce zero output. That is the tell.
A role-first chart is a coordination chart. It exists to manage humans, not to produce outputs.
The New Org Chart (Workflow-First)
Here is the same company redrawn around work.
Three humans. Five named agents. Four automations. Three surfaces. Thirteen-box chart down from seventeen, but that undersells the change. The old chart's work did not appear on the chart at all — it hid inside the boxes. The new chart shows the work, because the work runs on the workflow layer, and the workflow layer is the chart.
This is what SHRM and Fortune and BCG are all describing in prose. It is much clearer as a picture.
The Four Agent Archetypes on the New Chart
Inkeep's production data across customer-support deployments surfaces four canonical agent-role archetypes. Every Work Chart tends to include at least three of these four, regardless of vertical.
The production impact from teams that deploy the four-archetype pattern is the only hard data on this SERP worth citing:
| Metric | Before Work Chart | After Work Chart |
|---|---|---|
| Customer support ticket deflection rate | baseline | 60% higher (Gartner 2024) |
| Total support volume handled by human tier | 100% | 30–50% reduction |
| Median first-response latency | hours | 40% faster |
| Autonomous resolution accuracy | n/a | 90%+ |
Source: Inkeep's 2026 Work Chart report, aggregated across their enterprise deployments. These are the production numbers, not the demo numbers.
The Three Rules of the New Chart
Rule 1 — Every box is accountable to a human
Agents do not float. Every named agent (Sales Sam, Research Rita) reports to a human accountable owner. If the agent misbehaves, the human owns the fix. If it excels, the human owns the upgrade cycle. No floating AI.
In The Nvidia Way, Tae Kim documents how Jensen Huang runs one of the flattest structures in tech — roughly 60 direct reports, no one-on-ones — yet stays accountable by attaching a name to everything: every project has one "pilot in command," because "the ultimate boss is the mission itself." That is exactly Rule 1. The Work Chart names a single owner per workflow, so a flat chart never becomes an anonymous one. (How Jensen Huang runs NVIDIA is the longer study of that playbook.)
Rule 2 — The chart reads left-to-right, not top-to-bottom
Hierarchy is a coordination mechanism. It was necessary when the only workers were humans. Now the chart reads as a dataflow: input enters here, gets processed here, exits here. The hierarchy collapses into three human layers — founders, operators, specialists — and the rest is workflow.
Rule 3 — The chart lives in the running system
The old chart lived in PowerPoint, updated once a quarter, drifting from reality between updates. The new chart lives inside the Taskade workspace. The agents are real. The automations are real. The surfaces are real. If the chart changes, it changes because the work changed, not because HR redrew it.
Role → Workflow: The Conversion Table
Every traditional role breaks into 8–12 concrete tasks. Every task is Judge, Route, or Run. The conversion is mechanical.
| Traditional Role | Hidden task list (excerpt) | 2026 decomposition |
|---|---|---|
| Content Marketer | Write briefs, outline, draft, edit, source images, schedule, tag, distribute | Agent (Chloe) runs 6; human owns brief + final edit |
| SDR | Prospect list, enrichment, personalize, send, follow-up, qualify, hand off | Agent (Sam) runs 7; human owns replies + handoff calls |
| Tier-1 Support | Triage, research, draft reply, send, escalate, log | Agent (Sage) runs 4; human owns escalations + judgment |
| Analyst | Pull data, clean, chart, write commentary, share, follow up on questions | Agent (Ada) + Automation run 5; human owns commentary |
| Recruiter | Source, screen resumes, schedule calls, run intro, debrief, negotiate | Agent runs 4; human owns intro calls + negotiation |
| Product Manager | Research, synthesize feedback, prioritize, draft spec, coordinate, review | Agent (Rita) runs 3; human owns prioritization + decision |
| Executive Assistant | Calendar, email triage, travel, expense, meeting prep, notes | Agent + automations run 5; human owns exceptions |
You will notice a pattern: the Judge column never goes away. The Run column shrinks toward zero. The residual human work is the most valuable work. That has always been true. AI just made it obvious.
The Coordination Tax (The Cost That Disappears)
The single biggest win from workflow-first org design is what vanishes from the middle.
┌─────────────────────────────────────────────────────────────────┐
│  COORDINATION TAX — the hidden cost of a role-first org         │
├─────────────────────────────────────────────────────────────────┤
│                                                                 │
│  • Weekly 1:1s                         — 30 min × 10 direct     │
│                                          reports × manager =    │
│                                          40 hrs/mo gone         │
│  • Status updates (Slack, stand-ups)   — 20 min/day per person  │
│                                          × 15 people = 80 hrs/mo│
│  • Handoffs with context loss          — 5% of work redone      │
│  • Meetings about the meeting          — varies. Always too much│
│  • Wiki/doc drift                      — 2-4 hrs/week per team  │
│                                          reconstructing truth   │
│                                                                 │
│  Total: ~30-40% of total team hours in a 15-person org          │
└─────────────────────────────────────────────────────────────────┘
Agents do not need 1:1s. Automations do not write status updates. Handoffs inside a single workspace do not lose context — the Workspace DNA substrate preserves it.
A company that eliminates even half its coordination tax picks up the equivalent of hiring 3 extra people without hiring anyone. Now extend that across the new org chart, and the 3–5× headcount compression is not a mystery. It is just the coordination tax getting reclaimed. Push the compression all the way and you arrive at the one-person company — the chart with a single human box and a wall of named agents behind it.
The Seven Project Views Map Cleanly to Workflow Chart Types
Taskade ships with seven canonical project views — List, Board, Calendar, Table, Mind Map, Gantt, and Org Chart. They are not decoration. Each view answers a different workflow question.
| View | Answers | Best for |
|---|---|---|
| Org Chart | "Who or what owns this?" | The new workflow-first org chart itself |
| Board | "What is in-flight right now?" | Agent queue, automation triggers in motion |
| Table | "What does the data look like?" | Agent performance, workflow KPIs |
| Gantt | "What runs in what order?" | Multi-stage asset chains |
| Mind Map | "How do these ideas connect?" | Mapping role → tasks → workflows conversion |
| Calendar | "What triggers fire when?" | Automation schedules |
| List | "What's next?" | Day-to-day execution surface |
Timeline is inside the Gantt view, not a standalone view — seven in total. The canonical source is the taskadeViews array shipped with the product. Use the right view for the right workflow question.
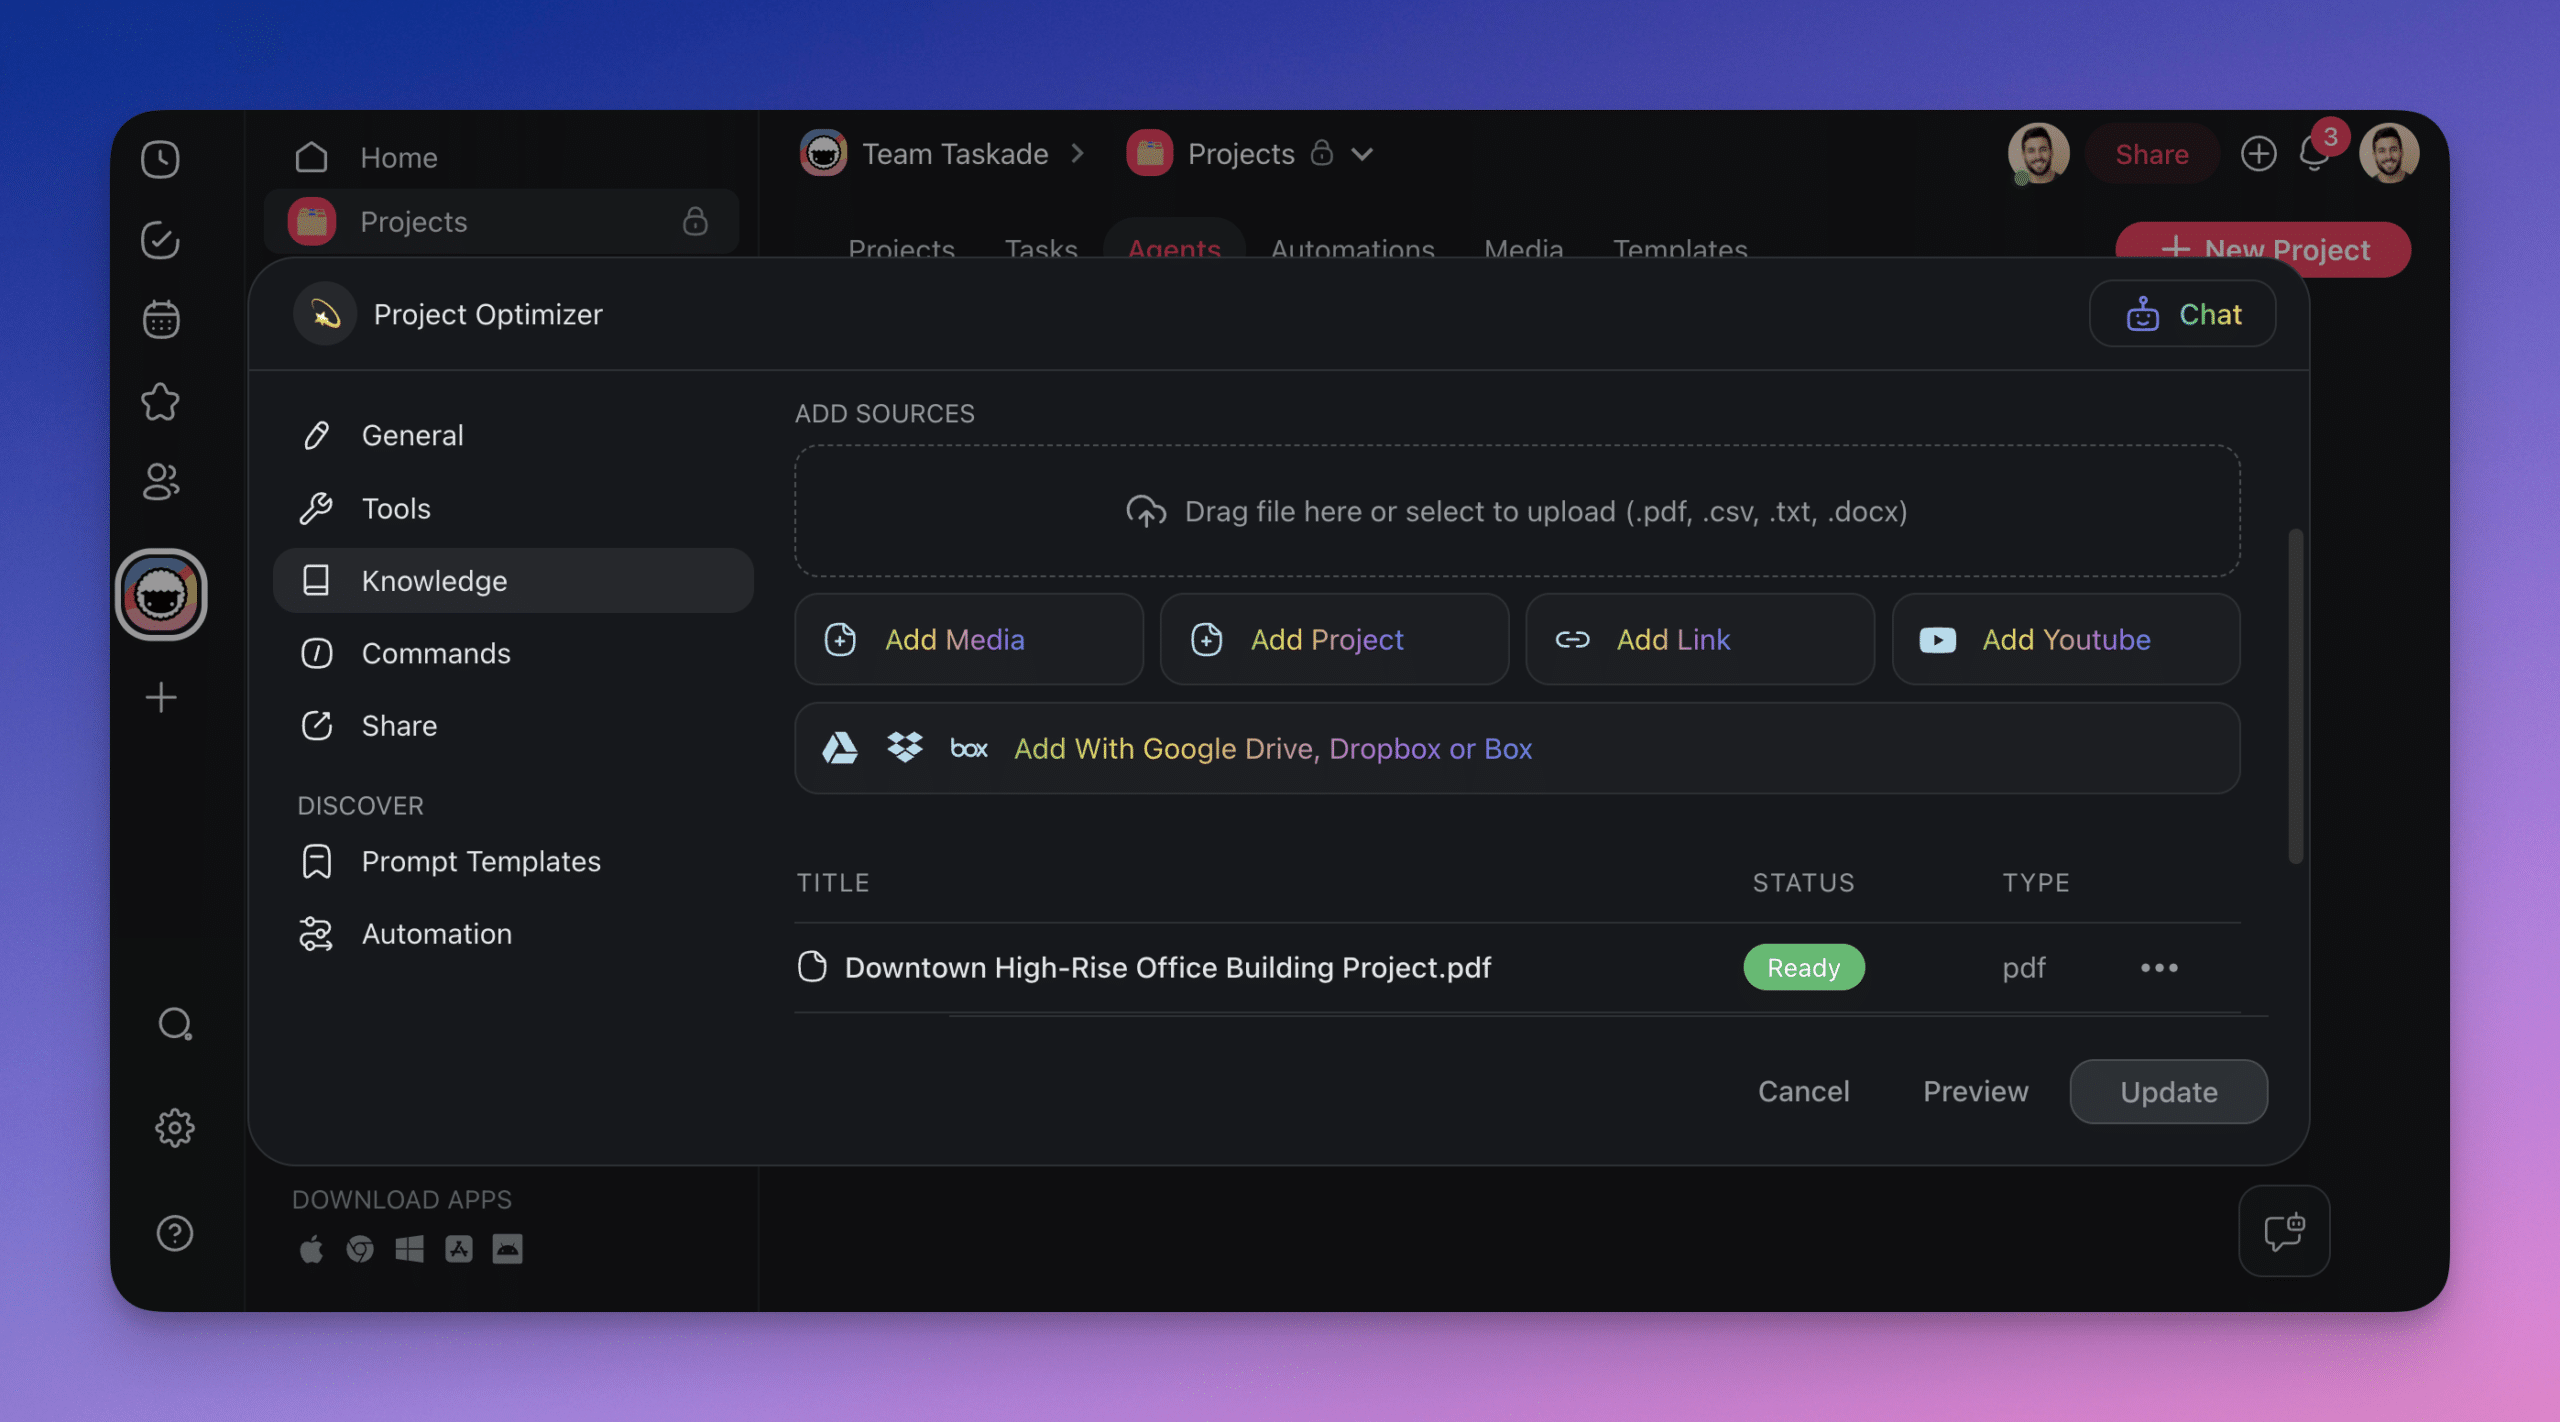
The Taskade Capability Map for the New Org Chart
| Work Chart layer | Taskade capability |
|---|---|
| Human Judge layer | 7 project views incl. Org Chart view · real-time OT collaboration |
| Agent layer | Agents v2 with names, accountable owners, custom tools, persistent memory |
| Automation layer | Durable execution with branching, looping, filtering · 100+ integrations |
| Surface layer | Genesis apps with custom domain, OIDC/SSO, password protection |
| Governance layer | 7-tier RBAC (Owner → Viewer) · workspace-scoped memory · audit trail |
| Distribution layer | Community Gallery + Clone button — publish Work Charts across the org |
This is why the new chart lives inside Taskade instead of PowerPoint: every row of the table is a running feature, not a diagram.
The 30-Day AI Org Chart Rewrite
┌──────────────────────────────────────────────────────────────────────┐
│  WEEK 1 — AUDIT                                                      │
│  ─────────────────                                                    │
│  - Print your current org chart                                      │
│  - Interview every role-holder: what 10 tasks do you actually do?   │
│  - Classify each task: Judge / Route / Run                           │
│  - Tally: % of total hours spent on Run tasks (usually 50-70%)      │
├──────────────────────────────────────────────────────────────────────┤
│  WEEK 2 — AGENT BUILD                                                │
│  ─────────────────                                                    │
│  - Pick top 5 Run tasks by volume                                    │
│  - Build 3 agents in Taskade covering those 5 tasks                 │
│  - Train each with 16+ samples from past work                        │
│  - Ship one Genesis app as the working surface                      │
├──────────────────────────────────────────────────────────────────────┤
│  WEEK 3 — AUTOMATE                                                   │
│  ─────────────────                                                    │
│  - Identify the top 3 Route tasks (where does work get handed off?) │
│  - Wire 3 automations that replace the handoffs                      │
│  - Measure: how much manager time did this free up?                 │
├──────────────────────────────────────────────────────────────────────┤
│  WEEK 4 — REDRAW                                                     │
│  ─────────────────                                                    │
│  - Draw the new chart: humans, agents, automations, surfaces        │
│  - Name each agent. Assign accountable human owners.                │
│  - Post it where the old chart used to live                         │
│  - Re-run the audit. The gap is the next month's roadmap.           │
└──────────────────────────────────────────────────────────────────────┘
Four weeks. One full workflow rewrite. Most teams compress the Run-layer by 40–70% in this window. That is not theory — it is the shape of every mid-size operator's workflow audit in Q1 2026.
The Honest Part (What Happens to the People)
The most-skipped section of every AI org chart essay: what happens to the humans who used to fill Run-layer roles.
Three possibilities, in order of frequency:
- They reskill toward the Judge layer. This is the best outcome. The person who previously spent 40 hours/week drafting cold emails becomes the person who designs, tunes, and audits the agent that drafts cold emails. Higher leverage, higher compensation, same person.
- They move to a different function. A Run-layer content writer becomes a customer success manager where Judge work (reading nuance, managing relationships) is still 80% of the job.
- They are out-leveraged. The person who does not reskill loses their job to an operator who did. This is ugly but real. The humane response is aggressive reskilling before the reorg, not after.
Pretending this is painless is dishonest. Pretending it is not happening is worse. The operators who adapt win. The operators who do not adapt become the buyers of the new software built by the ones who did.
If you manage a team, start the reskilling conversation this quarter. Not next. The Win With AI playbook maps the individual reskilling path. This post maps the org-level redesign.
Companion Reads
- Win With AI in 2026: The Workflow-First Playbook — the pillar this post sits under
- BYOA: The $1M-Per-Employee Era — the compensation model that makes this chart economic
- Training AI Agents Like Employees — how the named agents on the new chart actually get trained
- Multi-Agent Collaboration in Production — lessons from 500,000+ agent deployments
- The Workspace DNA Architecture — the substrate the new chart runs on
- Durable Execution AI Workflows — the retry-safe automation layer
- One-Person Companies: The Future of Work — what the chart looks like when it compresses all the way
- AI App Builders vs AI Workspace Builders — why the workspace, not the app, is the substrate for the new org
- The 2026 Productivity Playbook — the hub for workflow-first operators, agents, automations, and Genesis
Glossary Deep Dives
The vocabulary behind the new chart:
- Agentic AI — why roles compress into workflows in the first place
- Multi-Agent Systems, ReAct Pattern, Planning and Reasoning — how manager and specialist agents talk to each other
- Tool Use, Function Calling — how the agents on your chart reach into real systems
- Agentic RAG, Embeddings, Vector Database — how shared workspace memory becomes every agent's long-term recall
- Model Context Protocol, Taskade MCP Server, Taskade MCP Client — how your agents read and write across every external system your old chart siloed
- Ask Questions Tool, Human-in-the-Loop — the escalation paths on the new chart
- Evals, AI Alignment — how a manager reviews agent performance instead of headcount
- Genesis Auth, App Users — per-role access across every published app
The Chart Is the Company
The old truth: the org chart is a description of the company. The new truth: the chart is the company. Change the chart, you change the work. Change the work, the chart follows.
This is the first time in a hundred years the two have been literally the same artifact. Taskade Genesis is one of the few places that artifact actually runs — because Memory, Intelligence, and Execution share one workspace instead of five.
The operators who redraw their chart this quarter will be running a different kind of company by September. The ones who wait will be studying their competitors' charts in a case study.
Redraw your org chart in Taskade Genesis →
▲ ■ ● The chart is the company.
Frequently Asked Questions
How does an AI-first company organize differently?
An AI-first company organizes around workflows, not roles. Instead of drawing boxes for every job title and dotted lines for reporting relationships, the org chart shows inputs flowing through transformations to outputs. Humans own judgment, taste, and risk-taking. Agents own repeatable execution. Automations own the trigger logic that fires workflows without human touch. The chart has fewer boxes and more arrows.
What does an AI org chart actually look like?
An AI org chart shows four layers. Top layer — founders and judgment-heavy humans. Middle layer — workflow surfaces like published Genesis apps where humans and agents collaborate. Agent layer — named AI agents with custom tools and persistent memory, each owning a chain of repeatable tasks. Automation layer — triggers and connectors that route work between layers. The chart reads left-to-right (input to output), not top-to-bottom (boss to report).
Will AI flatten or eliminate middle management?
Both, depending on the function. Coordination-heavy middle management — the kind whose job is to relay information between layers — compresses fast because automation handles routing more reliably than humans. Judgment-heavy middle management — the kind that actually makes hiring, prioritization, and unblocking decisions — becomes more valuable, not less, because there are fewer of them covering more surface area.
How do you convert a traditional role into a workflow?
Four steps. First, list every concrete task the role performs — usually 8–12 tasks hiding under one title. Second, classify each task as Judge, Route, or Run. Third, move every Run task to an agent with appropriate tools. Fourth, move every Route task to an automation. What remains — the Judge tasks — is the human workflow. The role's original title often survives; the workload behind it looks nothing like the old version.
What happens to people when roles become workflows?
The honest answer: the bar rises. Operators who adapt become 3–10x more productive and keep their jobs. Operators who do not adapt get out-leveraged by the ones who did. The middle scenario — "we'll find something else for Danny to do" — usually does not hold, because the new something-else also got automated. The humane path is aggressive reskilling from Run-layer to Judge-layer work, starting now, not during the layoff.
Can you show a real before/after AI org chart?
Yes. Before — a 12-person marketing department with a VP, two managers, four specialists, two analysts, two writers, and a designer, all reporting up, with coordination handled in weekly meetings. After — one VP, two embedded operators, six named agents (outreach, content, SEO, analytics, social, paid), and five automations that route work between them. Headcount drops from 12 to 3. Output rises roughly 2–4×. The difference is the agent layer and the automation layer.
Where do Agents and Automations live on the new org chart?
In AI-first companies, agents and automations appear on the chart the same way human employees do — with names, owners, and responsibilities. Taskade Genesis customers commonly name their agents (Sales Sam, Research Rita, Ops Olivia) and assign a human accountable owner to each. This keeps accountability clear even when the worker is not a human.
Does every company need to redraw its org chart in 2026?
Not every company needs to redraw the formal chart today. But every operator running a team of more than three people should be privately running both charts — the official role-based chart HR keeps, and a shadow workflow chart that shows what actually produces output. When the gap between the two becomes embarrassing, the official chart catches up. Companies that wait for a perfect moment usually catch up after their competitors.
How does Taskade Genesis fit into the new org chart?
Taskade Genesis is where the workflow layer lives. Published Genesis apps become the working surfaces where humans and agents collaborate. Agents v2 are the named AI workers on the chart. Automations are the connective tissue. The org chart does not live in PowerPoint anymore — it lives in the workspace, because the chart and the running company are now the same artifact.
What is the first thing to automate in a traditional org?
Start with the highest-volume, lowest-judgment Run tasks. Typical candidates: inbound lead qualification, meeting notes and summaries, first-pass customer support replies, internal status updates, weekly reports, social post drafts, onboarding documentation. Each of these is a named workflow in most Genesis deployments. Moving even three of them off human time frees the team to do the judgment work the business actually needs.