


Spreadsheets are the cockroaches of business software.
They survive everything. Every new tool claims to replace them, yet here we are — still exporting CSVs, still formatting cells, still breaking formulas. Spreadsheets win because they are flexible. They lose because they do not think.
Taskade Genesis gives you spreadsheet flexibility with AI intelligence. Your data gets structured storage, AI-powered analysis, and automated workflows — without losing the quick-start simplicity that made spreadsheets popular in the first place. Here is a complete migration guide.
TL;DR: Spreadsheets store data but cannot analyze it. Taskade Genesis dashboards combine structured data with AI agents (15+ models from OpenAI, Anthropic, Google), 7 project views, and automated workflows via 100+ integrations. Export CSV, describe your dashboard, import, and retire the spreadsheet. Start free →
Why Spreadsheets Fail at Scale
Spreadsheets hit walls when data grows, teams expand, or processes become complex. The strengths that make them easy to start become weaknesses at scale:
| Spreadsheet Strength | Why It Becomes a Weakness |
|---|---|
| Flexible structure | No enforced consistency — anyone can change column types |
| Easy formulas | Complex formulas break silently — no error visibility |
| Quick to start | Hard to maintain — no schema, no validation |
| Everyone knows Excel | Everyone modifies Excel — no access control |
| Free-form entry | Data quality nightmare — inconsistent dates, names, categories |
The core problem: spreadsheets store data but do not understand it.
Genesis dashboards are different. They have:
- Schema — enforced structure that prevents data corruption
- Relations — connected data across tables and views
- Intelligence — AI agents that analyze trends and answer questions
- Automation — workflows that act on data changes via 100+ integrations
- Collaboration — 7-tier permissions (Owner through Viewer) so everyone has the right access level
The Migration Path: Spreadsheet to Living Dashboard
The migration follows four phases. Each builds on the previous:
Phase 1: Export Your Data
From your spreadsheet (Excel, Google Sheets, or Apple Numbers):
Step 1: Clean the Data
Before exporting, fix the issues that spreadsheets hide:
| Problem | Fix |
|---|---|
| Empty rows between sections | Delete all empty rows |
| Inconsistent date formats | Standardize to YYYY-MM-DD |
| Mixed text and numbers in columns | Separate into typed columns |
| Merged cells | Unmerge and fill values down |
| Comments and notes | Move to a dedicated "notes" column |
| Color-coded status | Replace with text labels (Active, Completed, Pending) |
Step 2: Export to CSV
- Google Sheets: File → Download → Comma Separated Values (.csv)
- Excel: File → Save As → CSV UTF-8
- Apple Numbers: File → Export To → CSV
Export one file per logical "table." If your spreadsheet has multiple tabs that represent different data types (contacts, deals, tasks), export each tab separately.
Step 3: Validate the Export
Open the CSV in a text editor and verify:
- Headers are clear and descriptive
- Data types are consistent within each column
- No encoding issues with special characters
- Row count matches your source spreadsheet
Phase 2: Design Your Dashboard
Before importing, decide what your dashboard needs to do. This is the step most migrations skip — and the reason most migrations fail.
Choose Your Dashboard Type
| If Your Spreadsheet Tracks... | Choose This Dashboard Type | Template to Clone |
|---|---|---|
| Expenses, revenue, budgets | Finance Dashboard | Finance Tracker |
| Investor metrics, runway | Investor Dashboard | Investor Dashboard |
| Equipment, assets, services | Operations Dashboard | Maintenance Tracker |
| Leads, deals, contacts | Sales Dashboard | Neon CRM |
| Tasks, assignments, deadlines | Project Dashboard | Team Capacity Planner |
Define What Intelligence You Need
Spreadsheets give you formulas. Dashboards give you intelligence:
| Spreadsheet Formula | Dashboard Intelligence |
|---|---|
=SUMIF(A:A, "Marketing", B:B) |
"What was my marketing spend last month?" (natural language) |
=VLOOKUP(...) |
Automatic field relationships across tables |
=IF(B2>1000, "Alert", "OK") |
Automated threshold alerts sent to Slack |
| Manual pivot table refresh | Real-time dashboard views with live data |
Plan Your Automations
List the manual processes tied to your spreadsheet:
| Manual Process | Automation Replacement |
|---|---|
| Email the spreadsheet weekly | Scheduled report via automation |
| Manually update status cells | Status change triggers notification |
| Copy data between sheets | Automatic field relationships |
| Color cells for thresholds | Alert automation when limits exceeded |
Phase 3: Build in Genesis
You have two approaches:
Option A: Start from a Template
- Browse Community Apps for matching dashboard templates
- Clone the closest match with one click
- Customize fields, views, and automations
- Import your CSV data into the project structure
This is the fastest path if a template matches your use case closely.
Option B: Generate from a Prompt
- Open Taskade Genesis
- Describe your dashboard in detail:
Build a finance dashboard to replace my expense tracking spreadsheet.
Include:
- Expense entries with category, amount, date, vendor, and payment method
- Budget tracking by category with monthly limits
- Monthly and annual summaries with trend comparisons
- AI agent that identifies spending patterns and anomalies
- Weekly email reports sent every Monday to the finance team
- Alert when any category exceeds 80% of its monthly budget
- Genesis creates the structured app with Projects, Agents, and Automations
- Import your CSV data into the project
Learn more in Create Your First App.
Import CSV Data
Once your dashboard structure exists:
- Navigate to the relevant Project (table)
- Use the Import function
- Select your CSV file
- Map spreadsheet columns to project fields
- Review and confirm the data mapping
- Data populates your dashboard across all 7 project views
Your spreadsheet data now lives in a structured system with schema enforcement, relationship tracking, and AI-ready formatting.
Phase 4: Add Intelligence and Automation
This is where Genesis dashboards pull ahead of spreadsheets permanently.
Natural Language Queries Replace Formulas
Instead of writing formulas, ask questions:
| Spreadsheet Formula | Genesis Natural Language Query |
|---|---|
=SUMIF(A:A, "Marketing", B:B) |
"What was my total marketing spend?" |
=AVERAGEIF(C:C, ">1000", D:D) |
"What is the average cost of purchases over $1,000?" |
=COUNTIFS(E:E, "Q1", F:F, "Sales") |
"How many sales transactions happened in Q1?" |
| Complex nested IF statements | "Which vendors had the highest cost increase this quarter?" |
AI agents powered by 15+ frontier models from OpenAI, Anthropic, and Google understand your data schema and return accurate answers. No formula syntax to memorize, no cell reference errors, no broken #REF! values.
Pattern Recognition Replaces Manual Analysis
The AI agent identifies patterns that spreadsheets cannot surface:
- Unusual spikes or drops — "Marketing spend jumped 40% in March" (automatic alert)
- Recurring patterns — "Travel expenses peak every quarter end" (trend identification)
- Anomalies — "This vendor invoice is 3x the historical average" (outlier detection)
- Opportunities — "Switching to annual billing for these 5 subscriptions saves $2,400/year" (optimization suggestions)
Automated Workflows Replace Manual Processes
Set up automations that replace your manual spreadsheet routines:
Connect automations to 100+ integrations including Slack, email, Google Calendar, Stripe, and Salesforce.
Common Migrations: Before and After
Budget Tracker Spreadsheet to Finance Dashboard
Before: Columns for date, description, amount, category in a Google Sheet
After: Finance Tracker Dashboard
![]()
What you gain:
- AI budget analysis that identifies overspend patterns
- Automated category suggestions for new entries
- Budget alert automations when limits approach
- Multi-view display (Board for categories, Calendar for timeline, Table for detail)
CRM Spreadsheet to Sales Dashboard
Before: Contact list with names, emails, deal values, and notes in Excel
After: Neon CRM Dashboard

What you gain:
- Pipeline visualization across deal stages using Board view
- Automated follow-up sequences via automations
- AI-powered lead scoring based on engagement and response patterns
- Team collaboration with 7-tier permissions
Project Tracker Spreadsheet to Operations Dashboard
Before: Task list with assignees, status, and due dates in a shared spreadsheet
After: Team Capacity Planner
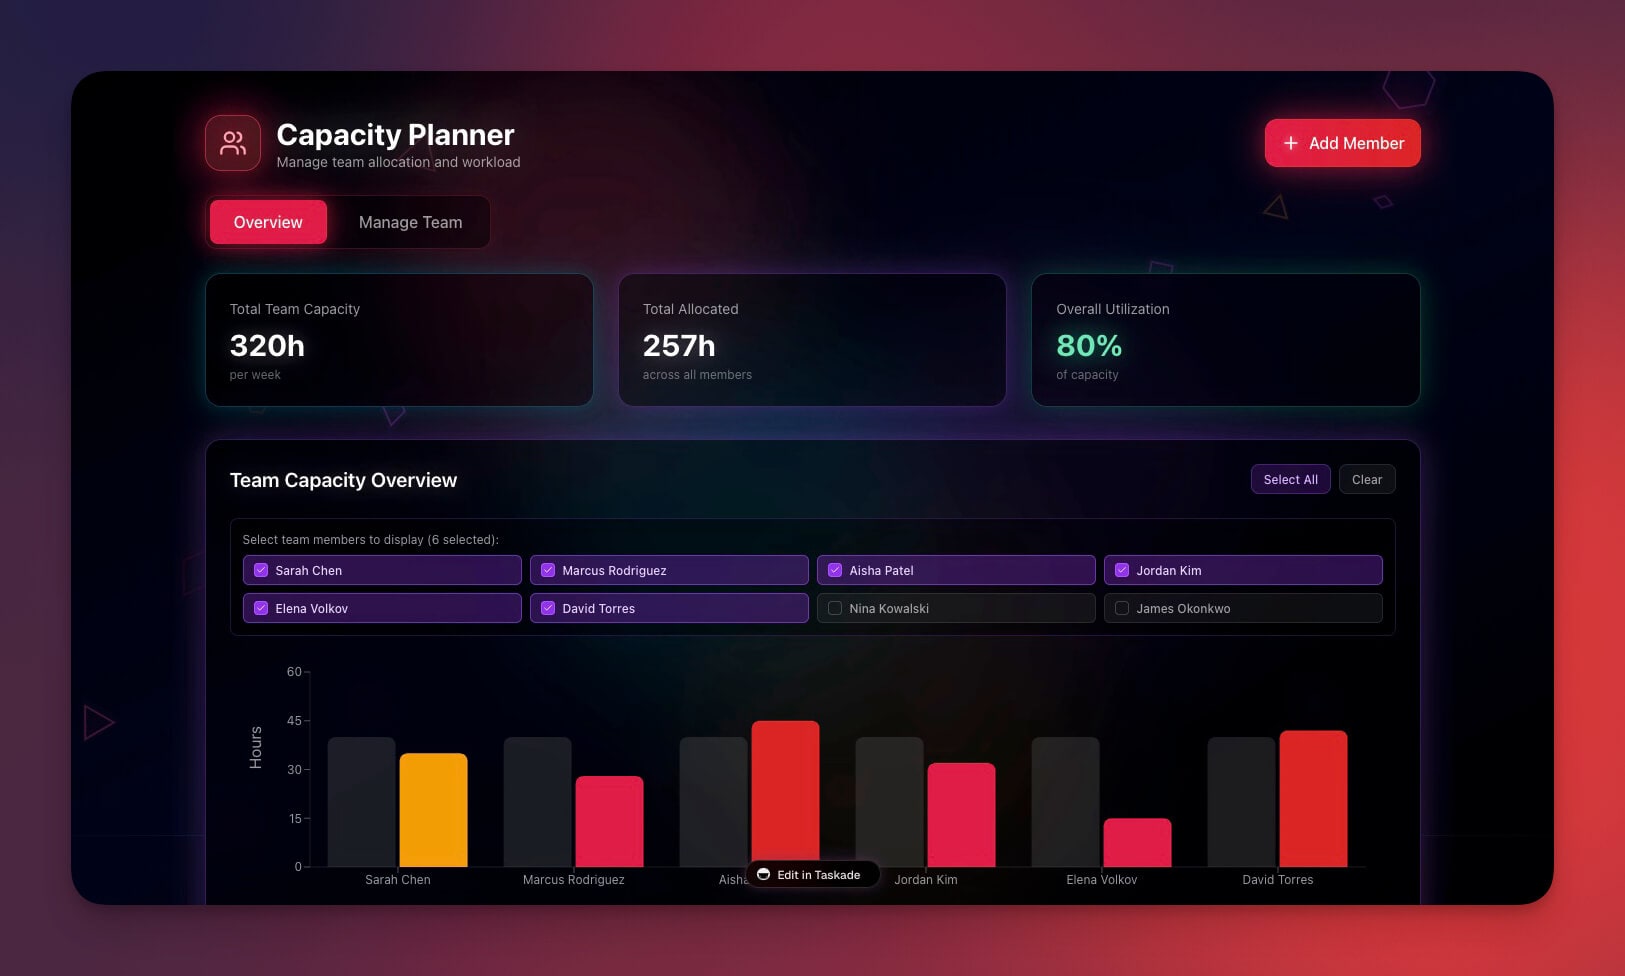
What you gain:
- Workload visualization across team members using Gantt and Org Chart views
- Assignment automation based on capacity and skill
- AI progress summaries generated weekly
- Real-time collaboration without formula conflicts
Equipment Log Spreadsheet to Maintenance Dashboard
Before: Asset list with service dates and costs in a maintenance spreadsheet
After: Maintenance Tracker Dashboard
![]()
What you gain:
- Service reminders triggered automatically before due dates
- Cost tracking with trend analysis by asset type
- Predictive maintenance signals from AI pattern recognition
- Calendar view for scheduling maintenance windows
The Seven Views Advantage
One of the biggest limitations of spreadsheets is that data lives in a single format: rows and columns. Taskade dashboards display the same data across 7 project views, each suited to different analysis needs:
| View | Best For | Spreadsheet Equivalent |
|---|---|---|
| List | Detailed line-item review | Closest to spreadsheet rows |
| Board | Status pipeline (Kanban) | No equivalent — requires manual grouping |
| Calendar | Date-based entries | Separate calendar tool needed |
| Table | Structured data with sorting and filtering | Similar to spreadsheet, but with typed fields |
| Mind Map | Category relationships and hierarchies | No equivalent |
| Gantt | Timeline and dependency tracking | Requires complex manual charting |
| Org Chart | Team structure and reporting lines | No equivalent |
The same expense data that appears as a Table for detailed entry becomes a Board grouped by approval status, a Calendar showing payment due dates, and a Gantt chart tracking budget allocation timelines. No duplicate data, no copy-paste, no formula linking between views.
View Recommendations by Dashboard Type
| Dashboard Type | Primary View | Secondary View | Analysis View |
|---|---|---|---|
| Finance | Table (data entry) | Board (approval pipeline) | Calendar (payment dates) |
| CRM / Sales | Board (deal stages) | Table (contact details) | Gantt (deal timeline) |
| Project Tracker | Board (task status) | Gantt (timeline) | Table (assignments) |
| Maintenance | Calendar (service dates) | Table (asset details) | List (upcoming tasks) |
| Inventory | Table (stock levels) | Board (reorder status) | List (low-stock alerts) |
Common Migration Mistakes and How to Avoid Them
Teams that fail at spreadsheet migration usually make one of these five mistakes:
1. Migrating everything at once. Start with one spreadsheet — the one causing the most pain. Prove the value, then migrate others. Trying to move 20 spreadsheets simultaneously leads to abandoned migrations.
2. Replicating the spreadsheet layout exactly. The goal is not to rebuild your spreadsheet in a new tool. The goal is to solve the problem your spreadsheet was solving — but better. Let Genesis design the schema based on your data needs, not your current column layout.
3. Skipping the data cleaning step. Garbage in, garbage out. Spreadsheets hide messy data behind formatting tricks (merged cells, color coding, hidden columns). Clean your data before import or the dashboard inherits the problems.
4. Not setting up automations from day one. The biggest ROI from migration comes from automations, not from better views. Set up at least one automation (weekly report, threshold alert, or status notification) before going live. This gives your team an immediate reason to prefer the dashboard over the spreadsheet.
5. No parallel run period. Run both the spreadsheet and dashboard side by side for one to two weeks. This catches edge cases (unusual data types, missing fields, broken automations) before you retire the spreadsheet. It also gives your team time to build confidence in the new system.
Who Should Migrate First
Not every team benefits equally from migration. Here is a prioritization framework:
| Team | Migration Priority | Reason |
|---|---|---|
| Finance / Accounting | High | Most formula-dependent, biggest automation ROI |
| Sales / CRM | High | Pipeline visibility dramatically improves with Board view |
| Operations / Facilities | Medium | Maintenance schedules benefit from Calendar + automation |
| Project Management | Medium | Already using project tools, but spreadsheet habits persist |
| HR / People Ops | Medium | Headcount tracking and onboarding benefit from structured data |
| Marketing | Lower | Often happy with spreadsheets for campaign tracking (migrate when team grows) |
| Engineering | Lower | Usually prefer code-based tools (migrate only shared tracking sheets) |
Start with the team that sends the most "Can someone fix the spreadsheet?" messages. That team will become your internal champion for dashboard adoption.
Feature Translation Guide: Spreadsheet to Dashboard
Here is exactly how your familiar spreadsheet features map to Genesis dashboard equivalents:
| Spreadsheet Feature | Genesis Equivalent | What Improves |
|---|---|---|
| Cells and rows | Records with typed fields | Data validation enforced |
| Formulas | Calculated fields + AI queries | No broken #REF! errors |
| Pivot tables | 7 project views | Real-time, no manual refresh |
| Conditional formatting | Status indicators + alert automations | Actions triggered, not just colors |
| Manual sharing via email | Real-time collaboration with permissions | No version conflicts |
| File versions (v1, v2 final) | Built-in version history | No "v2_final_FINAL.xlsx" |
| Charts and graphs | Dashboard views with live data | Always current, no stale snapshots |
| Macros (VBA) | Automations with 100+ integrations | More reliable, no script errors |
What changes:
- Structure is enforced (data quality improves)
- AI augments analysis (deeper insights without formula mastery)
- Automation replaces manual work (hours saved per week)
- Collaboration becomes real-time (no more email attachments)
Dashboard Prompt Templates
Here are ready-to-use prompts for migrating common spreadsheet types. Copy any prompt into Taskade Genesis and customize for your data:
Expense Tracking Prompt
Build a finance dashboard to replace my expense tracking spreadsheet.
Include:
- Expense entries with fields: date, vendor, amount, category, payment method, receipt, notes
- Budget limits by category with percentage-consumed indicator
- Monthly and annual summary views with year-over-year comparison
- AI agent that categorizes new expenses automatically based on vendor name
- Weekly expense summary report emailed every Friday at 5 PM
- Alert automation when any category exceeds 80% of monthly budget
- Board view grouping expenses by approval status (pending, approved, rejected)
CRM Migration Prompt
Build a sales CRM dashboard to replace my contact tracking spreadsheet.
Include:
- Contact records with name, email, phone, company, deal value, stage, last contact date
- Deal pipeline in Board view with stages: Lead, Qualified, Proposal, Negotiation, Won, Lost
- AI agent that scores leads based on engagement and deal size (1-100 score)
- Automated follow-up reminders when no contact for 7 days
- Monthly pipeline report generated and sent to sales manager
- Calendar view showing follow-up dates and meeting schedules
- Gantt view showing expected close dates across all active deals
Project Tracking Prompt
Build an operations dashboard to replace my project tracker spreadsheet.
Include:
- Task records with assignee, status, priority, due date, estimated hours, actual hours
- Board view by status: Backlog, In Progress, Review, Done
- Gantt view showing task dependencies and timeline
- AI agent that identifies overdue tasks and suggests priority adjustments
- Weekly progress report with completion percentages by team member
- Automation: notify assignee when task is assigned or priority changes
- Org Chart view showing team structure and task distribution
Each prompt creates a structured dashboard with Projects for data, AI Agents for analysis, and Automations for workflow execution. Import your CSV data after the structure is created.
Migration Checklist
Use this checklist to track your migration progress:
| Step | Action | Status |
|---|---|---|
| 1 | Identify the highest-pain spreadsheet | |
| 2 | Clean data (remove empty rows, standardize formats) | |
| 3 | Export to CSV (one file per data type) | |
| 4 | Choose a template or write a Genesis prompt | |
| 5 | Create the dashboard in Genesis | |
| 6 | Import CSV data and map columns | |
| 7 | Configure 7 project views | |
| 8 | Add AI agents for analysis | |
| 9 | Set up automations for reports and alerts | |
| 10 | Set permissions for team access | |
| 11 | Run both systems in parallel for 1 week | |
| 12 | Retire the spreadsheet |
The parallel period (step 11) is important. Run both the spreadsheet and dashboard for one week to verify that all data flows correctly before retiring the old system.
Start Migrating
Move your first spreadsheet today:
- Open Taskade Genesis and choose or create a dashboard
- Export and clean your spreadsheet data
- Import CSV to your Genesis project
- Add AI agents for natural language analysis
- Set up automations for reports and alerts
- Retire the spreadsheet
Templates to clone:
- Finance Tracker Dashboard — Budget and expense tracking
- Maintenance Tracker — Equipment and asset management
- Team Capacity Planner — Project and workload tracking
- Neon CRM Dashboard — Sales pipeline management
- Investor Dashboard — Metrics and runway tracking
Documentation:
- Projects and Databases — Data structure
- Custom AI Agents — Analysis capabilities
- Automations Guide — Workflow setup
- Views Overview — 7 project views
- Integrations — 100+ connections
Read more:
- 10 AI Dashboards You Can Clone in One Click
- 10 AI Finance Workspaces for Founders
- AI Workspace Builder: Turn Your List Into Live Software
- How Workspace DNA Works
- Build a Finance Dashboard
- AI App Builder vs Website Builder vs Agent Builder
Explore Taskade AI:
- AI Dashboard Builder — Generate dashboards
- AI App Builder — Build complete applications
- AI Workflow Automation — Automate processes
Build with Taskade Genesis:
- Browse All Generator Templates — Apps, dashboards, websites, and more
- Browse Agent Templates — AI agents for every use case
- Explore Community Apps — Clone and customize

Frequently Asked Questions
Why should I migrate from spreadsheets to AI dashboards?
Spreadsheets are flexible but lack intelligence. They do not validate data, spot trends, or automate actions. AI dashboards built with Taskade Genesis combine spreadsheet flexibility with AI-powered insights, automated calculations, and self-updating workflows. You get structured data backed by AI agents running on 15+ frontier models from OpenAI, Anthropic, and Google.
How do I migrate Excel or Google Sheets data to Taskade Genesis?
Export your spreadsheet as CSV, clean and standardize the data, then describe the dashboard you want in a Genesis prompt. Genesis creates a structured app with proper database schemas, AI agents that analyze your data, and automated workflows via 100+ integrations. You can also paste data directly and let AI agents organize it into the right format.
What can an AI dashboard do that a spreadsheet cannot?
AI dashboards auto-categorize entries, generate insights from trends, trigger alerts on anomalies, run automated workflows, and present data across 7 project views (List, Board, Calendar, Table, Mind Map, Gantt, Org Chart). AI agents powered by 15+ models can answer natural language questions about your data like 'What was my highest expense category last month?' without writing formulas.
Can my team collaborate on AI dashboards in real time?
Yes. Taskade dashboards support real-time collaboration with 7-tier role-based permissions (Owner, Maintainer, Editor, Commenter, Collaborator, Participant, Viewer). Unlike spreadsheets where anyone can break formulas, structured Genesis dashboards enforce data integrity while giving each team member the appropriate level of access.
How much does it cost to migrate from spreadsheets to Taskade?
Taskade offers a free tier to get started. Paid plans start at $10 per month for Pro with up to 10 users and $25 per month for Business with unlimited users (billed annually). This replaces both your spreadsheet management overhead and the separate analytics tools you may be paying for. All plans include AI agents and 100+ integrations.
Will I lose spreadsheet features like formulas and pivot tables?
You trade manual formulas for AI-powered equivalents. Spreadsheet cells become structured records with typed fields. Formulas become calculated fields plus AI natural language queries. Pivot tables become dashboard views and filterable project views. Conditional formatting becomes status indicators and automated alerts. You gain intelligence and automation while keeping the analytical power.
Can I still export data back to spreadsheets?
Yes. Taskade Projects support data export, so you can move data back to CSV or Excel format at any time. This is useful for sharing with external stakeholders who prefer spreadsheets, for regulatory compliance that requires specific formats, or as a backup during your migration transition period.
What types of spreadsheets should I migrate first?
Start with spreadsheets that cause the most pain: ones with broken formulas, manual update processes, or collaboration conflicts. Budget trackers, CRM contact lists, project task lists, and equipment maintenance logs are ideal first migrations because they benefit most from structured data, AI analysis, and automated workflows.
How do AI agents analyze dashboard data?
AI agents powered by 15+ frontier models from OpenAI, Anthropic, and Google can read your project data and answer natural language questions. Ask 'Show me spending trends over the quarter' or 'Which vendor costs are increasing fastest?' and get answers without writing formulas. Agents also proactively identify anomalies, predict trends, and suggest optimizations.
Can I automate reports that I currently build manually in Excel?
Yes. Taskade Automations can generate and send reports on a schedule, such as weekly summaries every Monday or monthly dashboards on the first of each month. Reports are compiled by AI agents from your live project data, formatted automatically, and delivered via email, Slack, or other channels through 100+ integrations.