


Operations is memory in execution.
Every ticket, every metric, every handoff — it is all signal. The problem is that most ops teams drown in spreadsheets, Slack pings, and dashboards that are outdated before they are finished.
Taskade Genesis changes that. It turns a single prompt into a living operations center — complete with real-time data (Projects), intelligent assistants (AI Agents), and self-updating workflows (Automations).
TL;DR: Clone 10 AI-powered ops dashboards that update themselves with intelligent
agents and automated workflows. Each dashboard includes structured data, AI analysis,
and 100+ integrations — built on Taskade Genesis starting at $6/month.
Browse all dashboards →
Quick Reference: All 10 Ops Dashboards
| # | Dashboard | Best For | Key AI Feature | Clone |
|---|---|---|---|---|
| 1 | Maintenance Tracker | Facilities, fleet | Predictive scheduling | Clone → |
| 2 | Team Capacity Planner | PMs, resource planning | Workload analysis | Clone → |
| 3 | Support Rating Dashboard | CS teams, QA | Satisfaction trends | Clone → |
| 4 | Neon Task Dashboard | Creative teams, startups | Priority optimization | Clone → |
| 5 | Monochrome Project Dashboard | Consultants, minimalists | Milestone tracking | Clone → |
| 6 | Hospitality Insight Dashboard | Hotels, Airbnb hosts | Occupancy forecasting | Clone → |
| 7 | Room Booking Dashboard | Coworking, conferences | Conflict detection | Clone → |
| 8 | Investor Dashboard | Founders, IR teams | KPI narratives | Clone → |
| 9 | Finance Tracker Dashboard | Operations, finance | Budget monitoring | Clone → |
| 10 | Neon CRM Dashboard | Sales ops, growth | Pipeline analysis | Clone → |
Every dashboard runs on Workspace DNA — Memory (data), Intelligence (AI agents), and Execution (automations) working as one system. Clone any dashboard in one click and customize it for your team.
Why Static Dashboards Fail Lean Teams
Lean teams cannot afford to spend hours updating spreadsheets, pulling reports, or manually routing tickets. Static dashboards fail in three specific ways.
| Problem | Static Dashboard | Genesis Ops Dashboard |
|---|---|---|
| Data freshness | Stale the moment you build it | Self-updating via automations |
| Analysis | You read numbers, you interpret | AI agent analyzes trends, flags anomalies |
| Action | You see a problem, you act manually | Automations trigger responses instantly |
| Reporting | Manual export to slides/email | Scheduled summaries sent automatically |
| Access control | Shared link or export | 7-tier RBAC (Owner to Viewer) |
Genesis dashboards are living systems powered by three pillars that work together continuously.
1. Maintenance Tracker Dashboard
![]()
Track equipment status, maintenance schedules, and service history across your entire operation. The AI agent predicts when equipment will need service based on historical maintenance intervals and usage patterns.
Best for: Facilities managers, property operations, fleet management
| Feature | Description |
|---|---|
| Equipment inventory | Status tracking with condition ratings and location |
| Scheduled maintenance | Calendar-based alerts with configurable intervals |
| Service history | Complete log of all maintenance activities per asset |
| Cost tracking | Maintenance spend by asset, category, and time period |
| AI predictions | Agent analyzes history and flags upcoming maintenance needs |
Automations included:
- Maintenance due date approaching → Slack notification to facilities team
- Service completed → Update equipment status and log in history
- Cost threshold exceeded → Alert operations manager
2. Team Capacity Planner
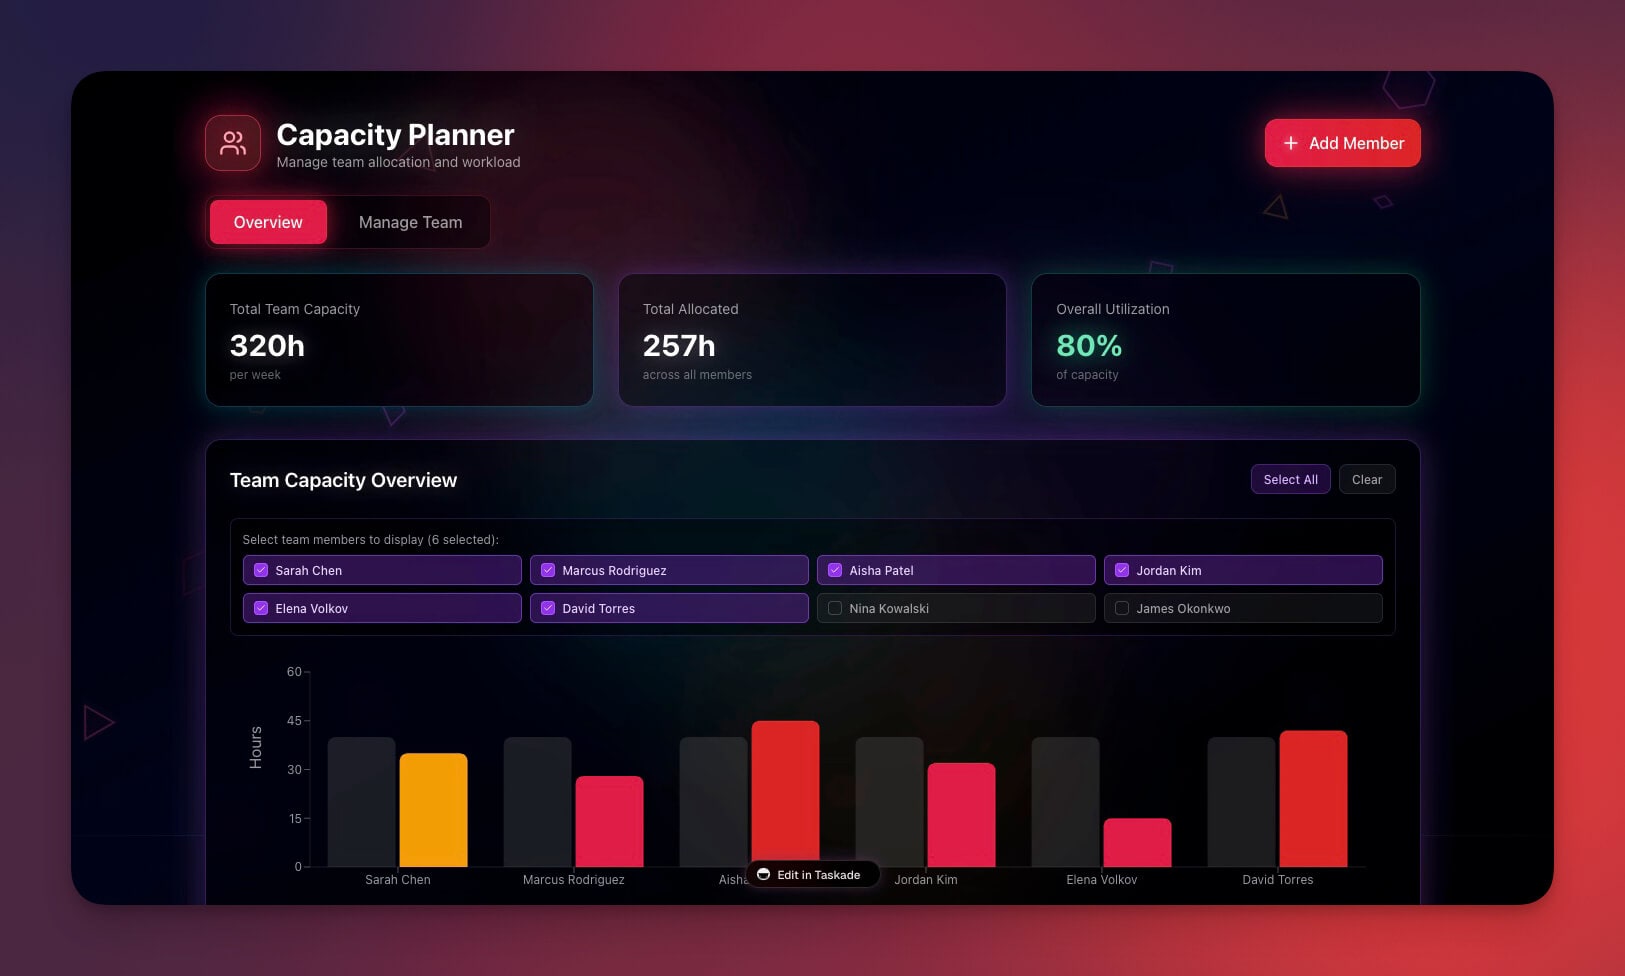
Visualize team workload, availability, and resource allocation in real-time. The AI agent identifies overloaded team members and suggests rebalancing before burnout hits.
Best for: Project managers, team leads, resource coordinators
| Feature | Description |
|---|---|
| Availability grid | Team member status with vacation and out-of-office tracking |
| Workload distribution | Visual breakdown of assigned tasks per person |
| Project assignments | Cross-project resource tracking |
| Capacity forecasting | AI-predicted availability for upcoming sprints |
| Utilization reports | Percentage utilization by team member and time period |
Automations included:
- Team member utilization exceeds 90% → Alert to manager
- New project assignment → Auto-check capacity conflicts
- Weekly capacity report → Sent every Monday to leadership
3. Support Rating Dashboard
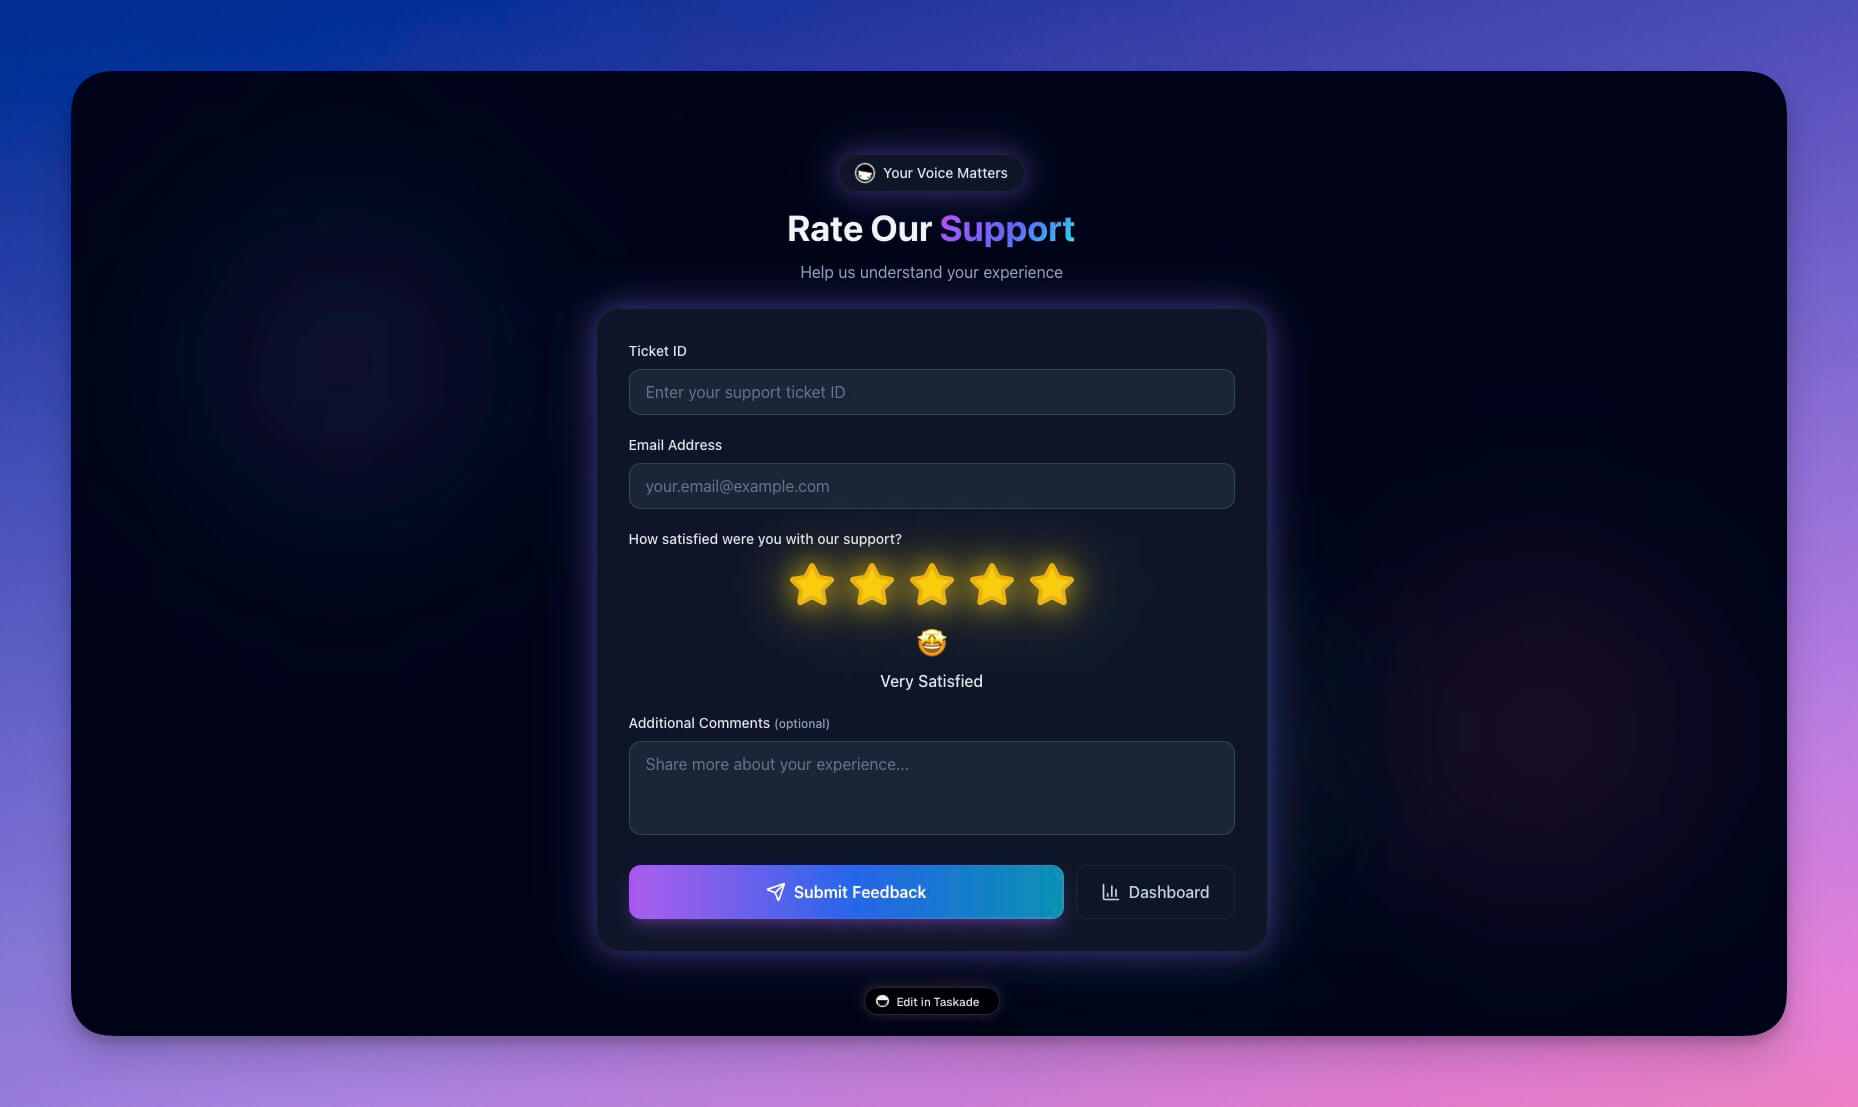
Monitor customer satisfaction scores, ticket resolution times, and support team performance. The AI agent identifies declining satisfaction trends and suggests root causes.
Best for: Support managers, CS teams, quality assurance
| Feature | Description |
|---|---|
| CSAT tracking | Satisfaction scores with trend lines |
| Response metrics | First response time, resolution time, SLA compliance |
| Agent leaderboard | Performance ranking by satisfaction and resolution speed |
| Issue categorization | AI-suggested labels for incoming tickets |
| Trend analysis | Weekly and monthly pattern detection |
Automations included:
- CSAT drops below threshold → Escalation to team lead
- SLA breach imminent → Priority bump and notification
- Weekly quality report → Distributed to management
Clone Support Rating Dashboard →
4. Neon Task Management Dashboard
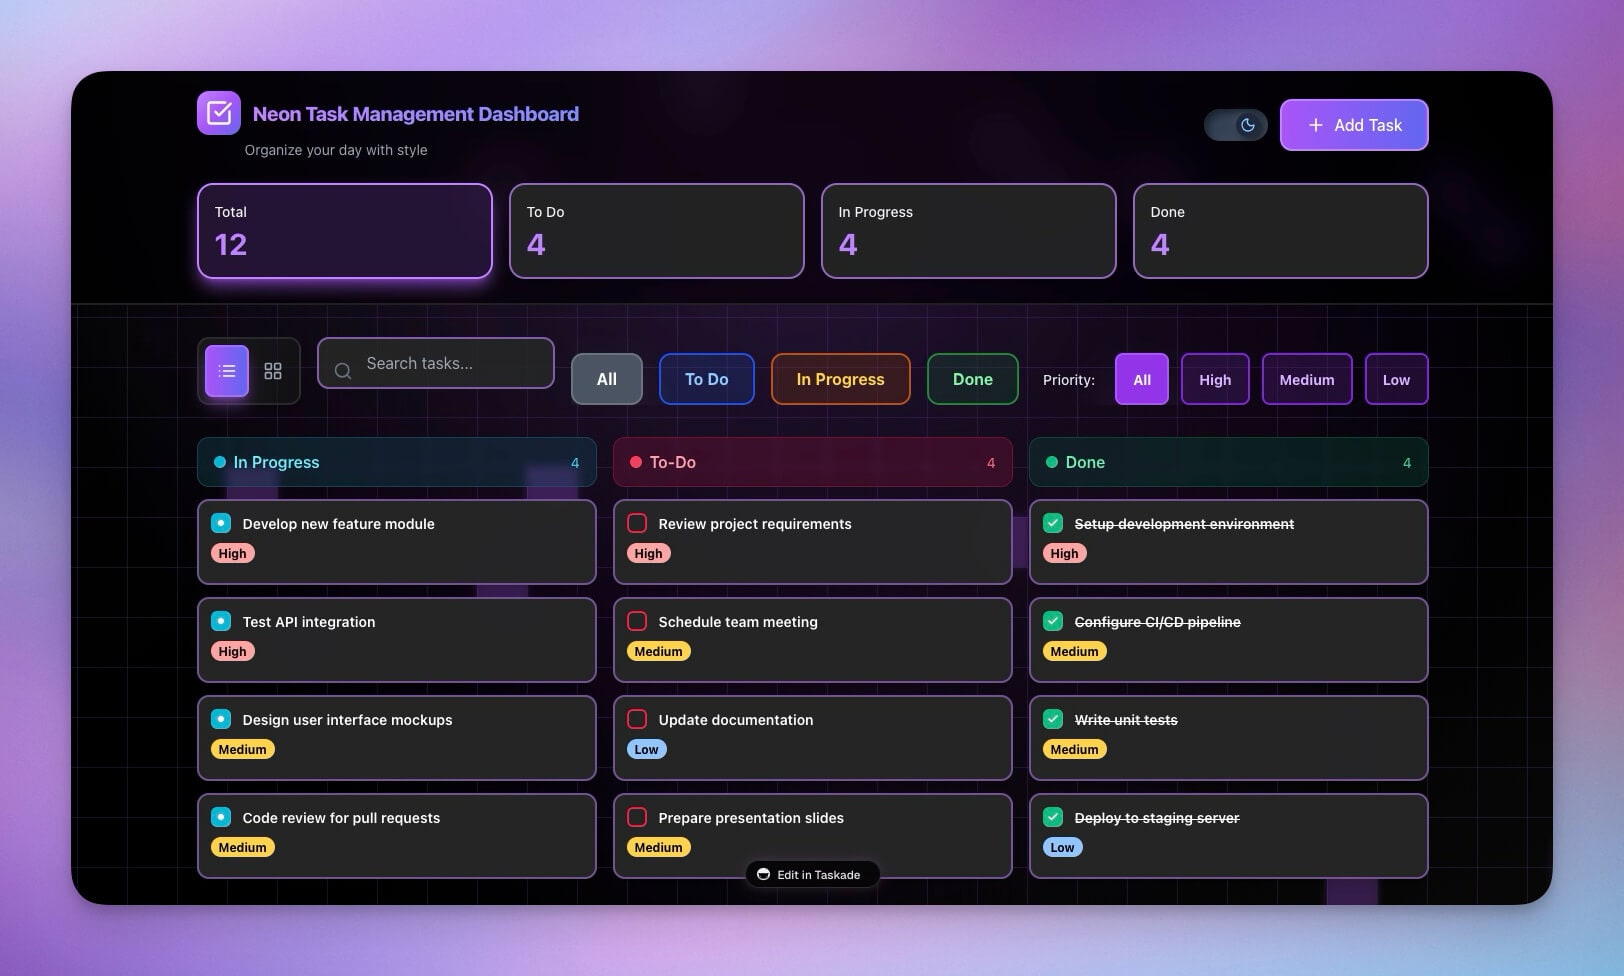
A visually striking task management system with neon aesthetics and powerful workflow features. The AI agent optimizes task priority based on deadlines, dependencies, and team capacity.
Best for: Creative teams, startups, agencies
| Feature | Description |
|---|---|
| Kanban board | Drag-and-drop with neon-styled columns |
| Priority sorting | AI-optimized task ordering by urgency and impact |
| Due date tracking | Calendar integration with overdue alerts |
| Team assignment | Multi-assignee support with workload visibility |
| Sprint planning | Velocity tracking and commitment analysis |
5. Monochrome Project Dashboard
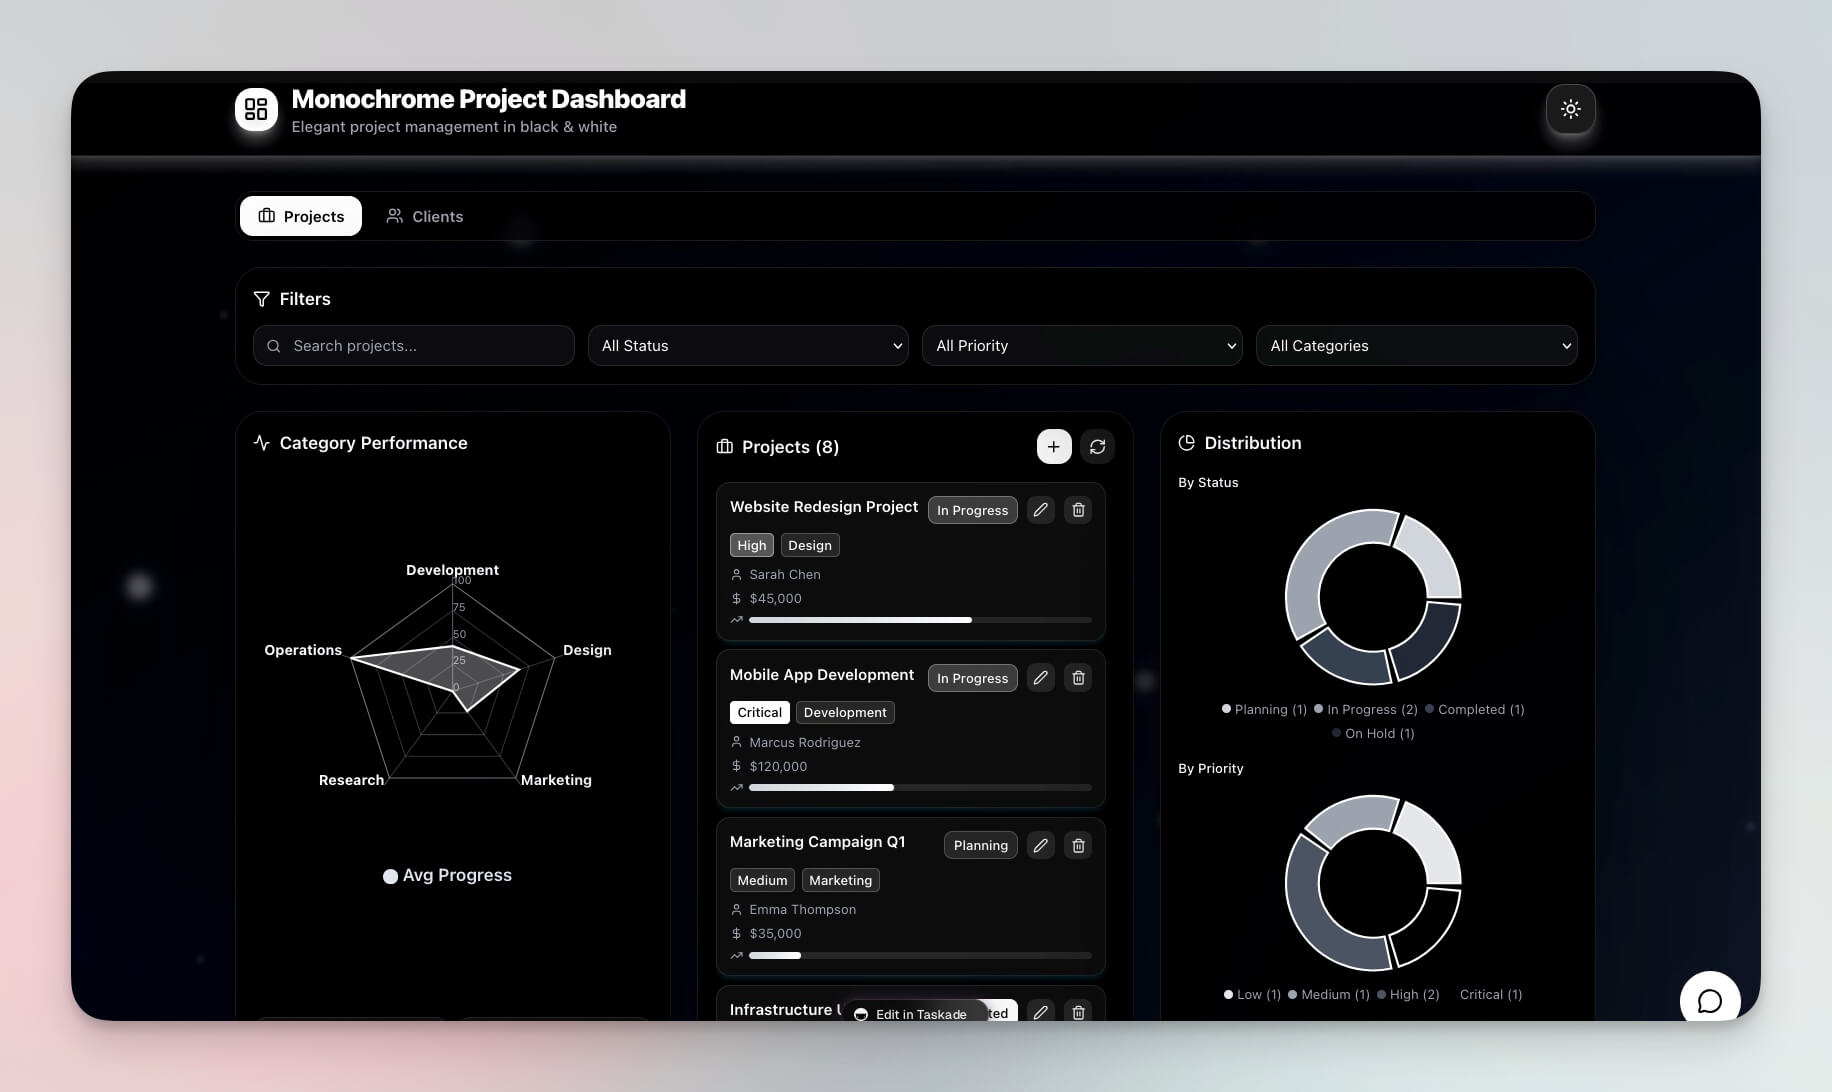
A clean, minimal project tracking interface focused on clarity. The AI agent provides concise status summaries and flags at-risk milestones.
Best for: Consultants, solo operators, minimalists
| Feature | Description |
|---|---|
| Project overview | Clean cards with status, progress, and next actions |
| Milestone tracking | Visual progress bars with deadline indicators |
| Status updates | Structured updates with AI-generated summaries |
| Focus mode | Distraction-free single-project view |
6. Hospitality Insight Dashboard
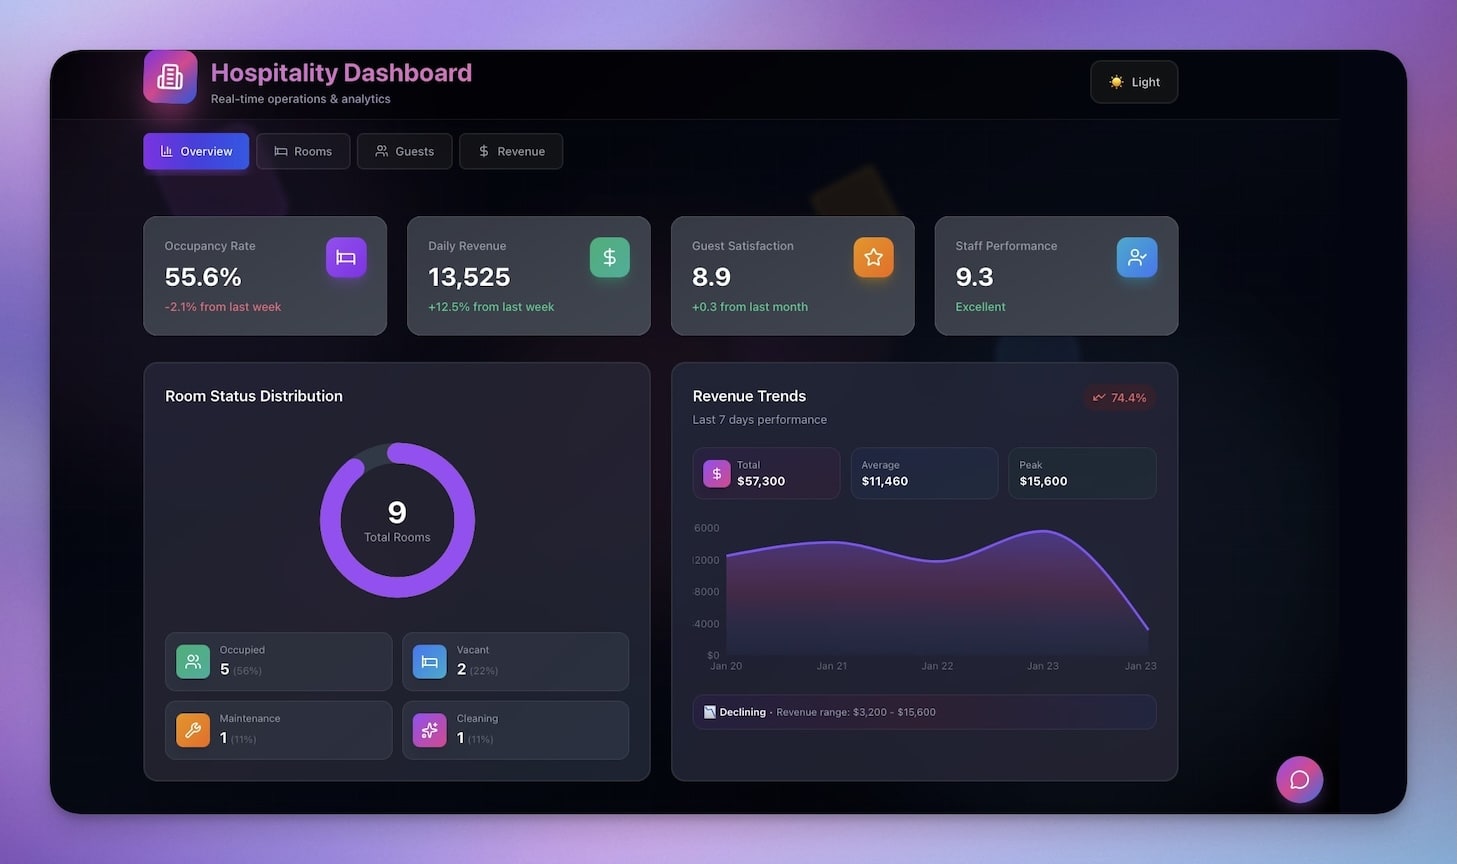
Track occupancy, guest satisfaction, and operational metrics for hospitality businesses. The AI agent forecasts occupancy trends and suggests pricing adjustments.
Best for: Hotel managers, Airbnb hosts, property managers
| Feature | Description |
|---|---|
| Occupancy tracking | Real-time room availability and booking rates |
| Guest reviews | Aggregated satisfaction scores from multiple channels |
| Revenue metrics | ADR (average daily rate), RevPAR, and occupancy percentage |
| Seasonal analysis | Year-over-year trend comparison with AI forecasting |
| Maintenance queue | Property maintenance requests linked to room status |
7. Room Booking Dashboard
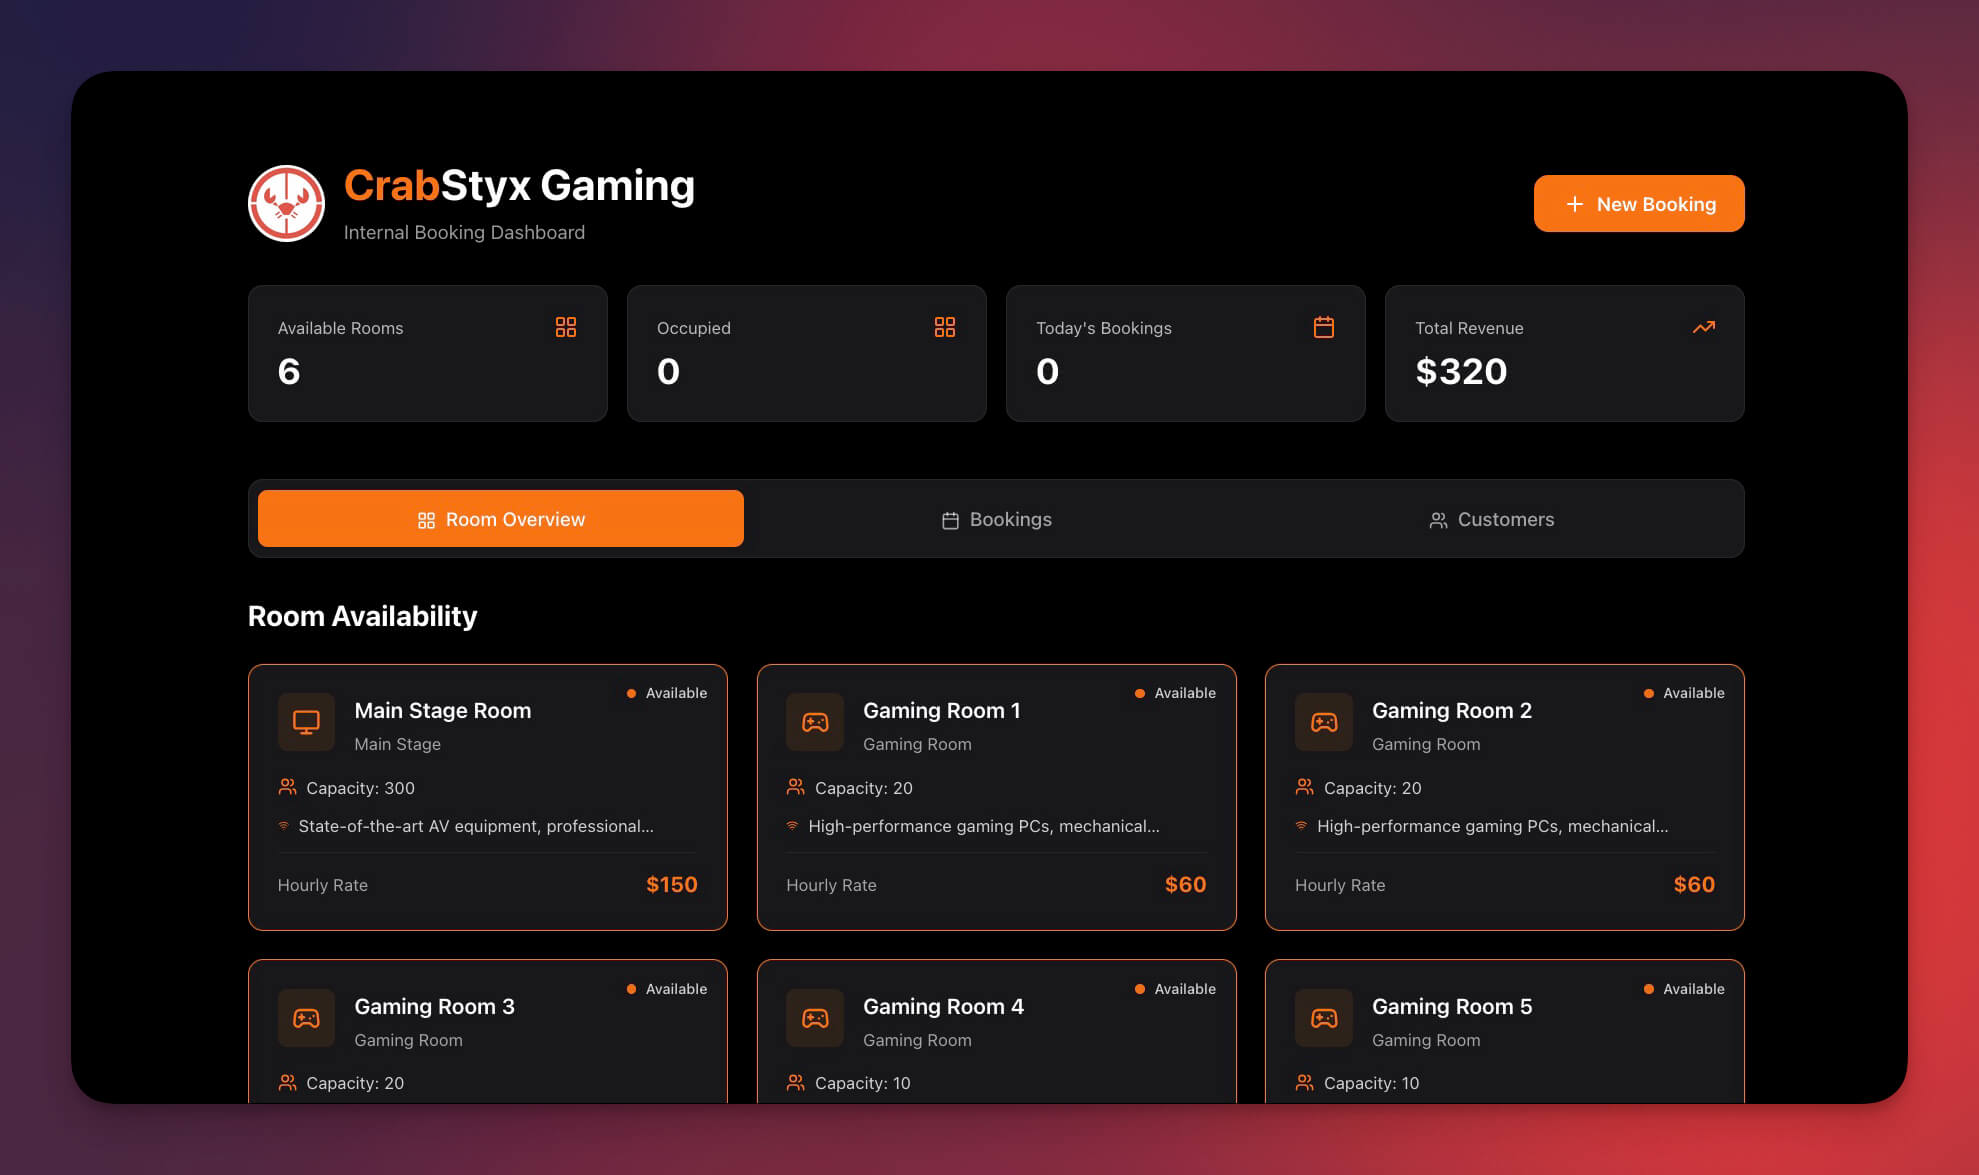
Manage room reservations, availability, and booking workflows with AI-powered conflict detection.
Best for: Coworking spaces, conference centers, shared offices
| Feature | Description |
|---|---|
| Availability calendar | Visual room grid with real-time booking status |
| Conflict detection | AI flags double-bookings and suggests alternatives |
| Booking requests | Approval workflow for room reservations |
| Utilization reports | Room usage by time, day, and department |
| Recurring bookings | Template for weekly and monthly room holds |
Clone Room Booking Dashboard →
8. Investor Dashboard
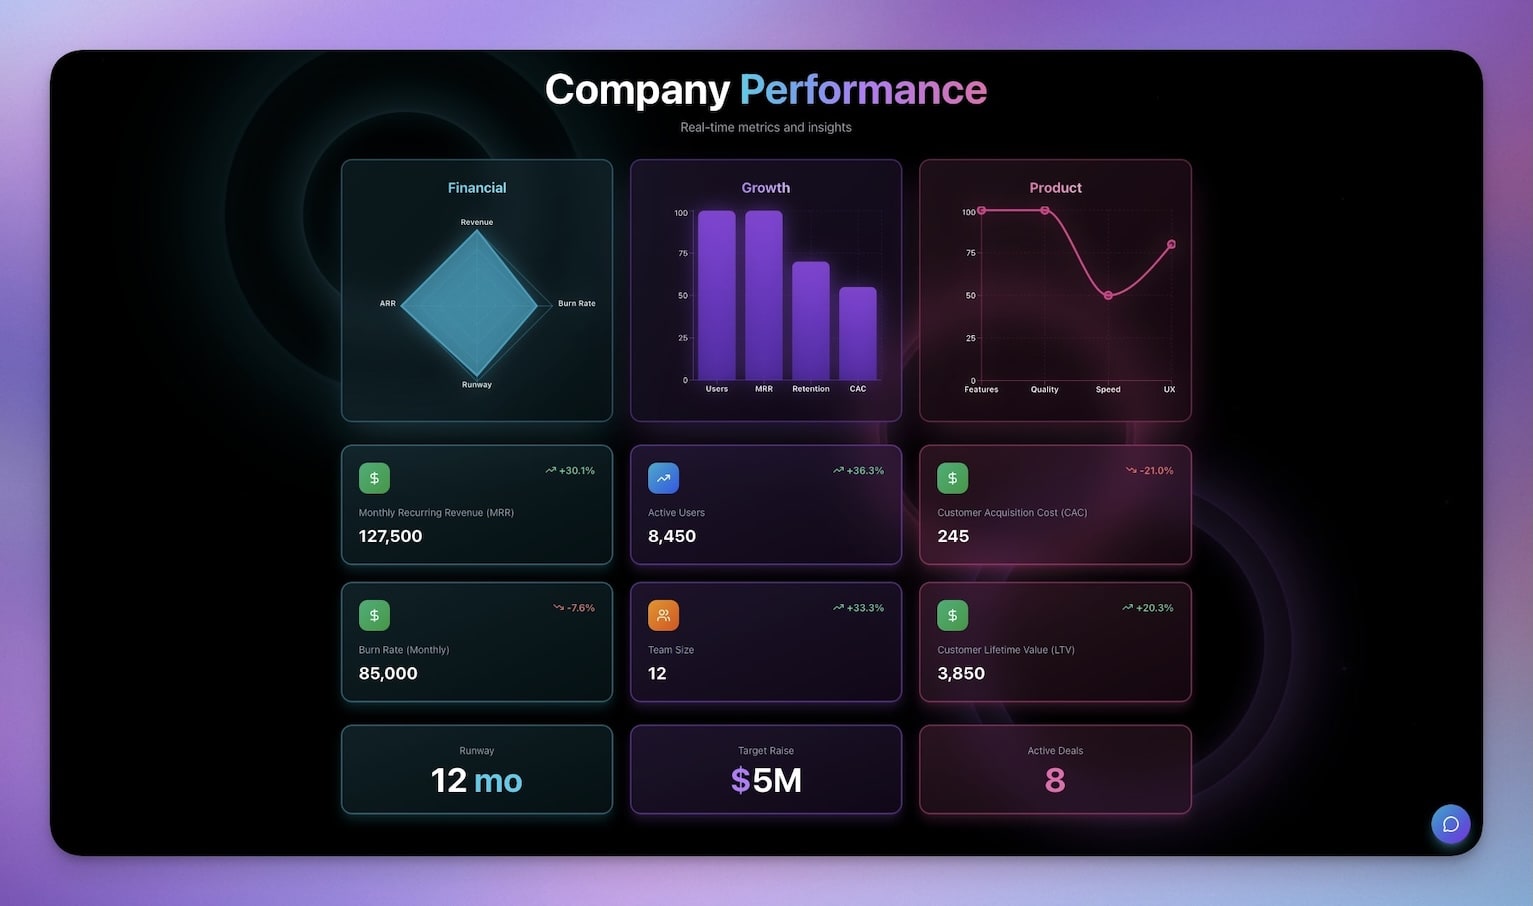
Present company metrics, KPIs, and progress updates to stakeholders. The AI agent generates narrative summaries of metric changes for board updates.
Best for: Founders, CFOs, investor relations
| Feature | Description |
|---|---|
| KPI visualization | Key metrics with trend indicators and targets |
| Milestone tracking | Quarterly goals with progress percentages |
| Financial summaries | Revenue, burn rate, and runway calculations |
| Update history | Version-controlled investor communications |
| AI narratives | Agent generates written summaries of metric changes |
9. Finance Tracker Dashboard
![]()
Monitor cash flow, expenses, and financial health in real-time. The AI agent answers natural-language questions about spending and flags budget overruns.
Best for: Operations teams, finance managers, founders
| Feature | Description |
|---|---|
| Expense categorization | AI-suggested categories for every transaction |
| Cash flow visualization | Income vs. expense trends with balance projections |
| Budget monitoring | Category budgets with threshold alerts at 80% |
| AI insights | "What did I spend on marketing this month?" in natural language |
| Weekly summaries | Formatted digest sent automatically every Sunday |
For a full tutorial on building this dashboard from scratch, see How to Build a Finance Dashboard in 10 Minutes.
10. Neon CRM Dashboard
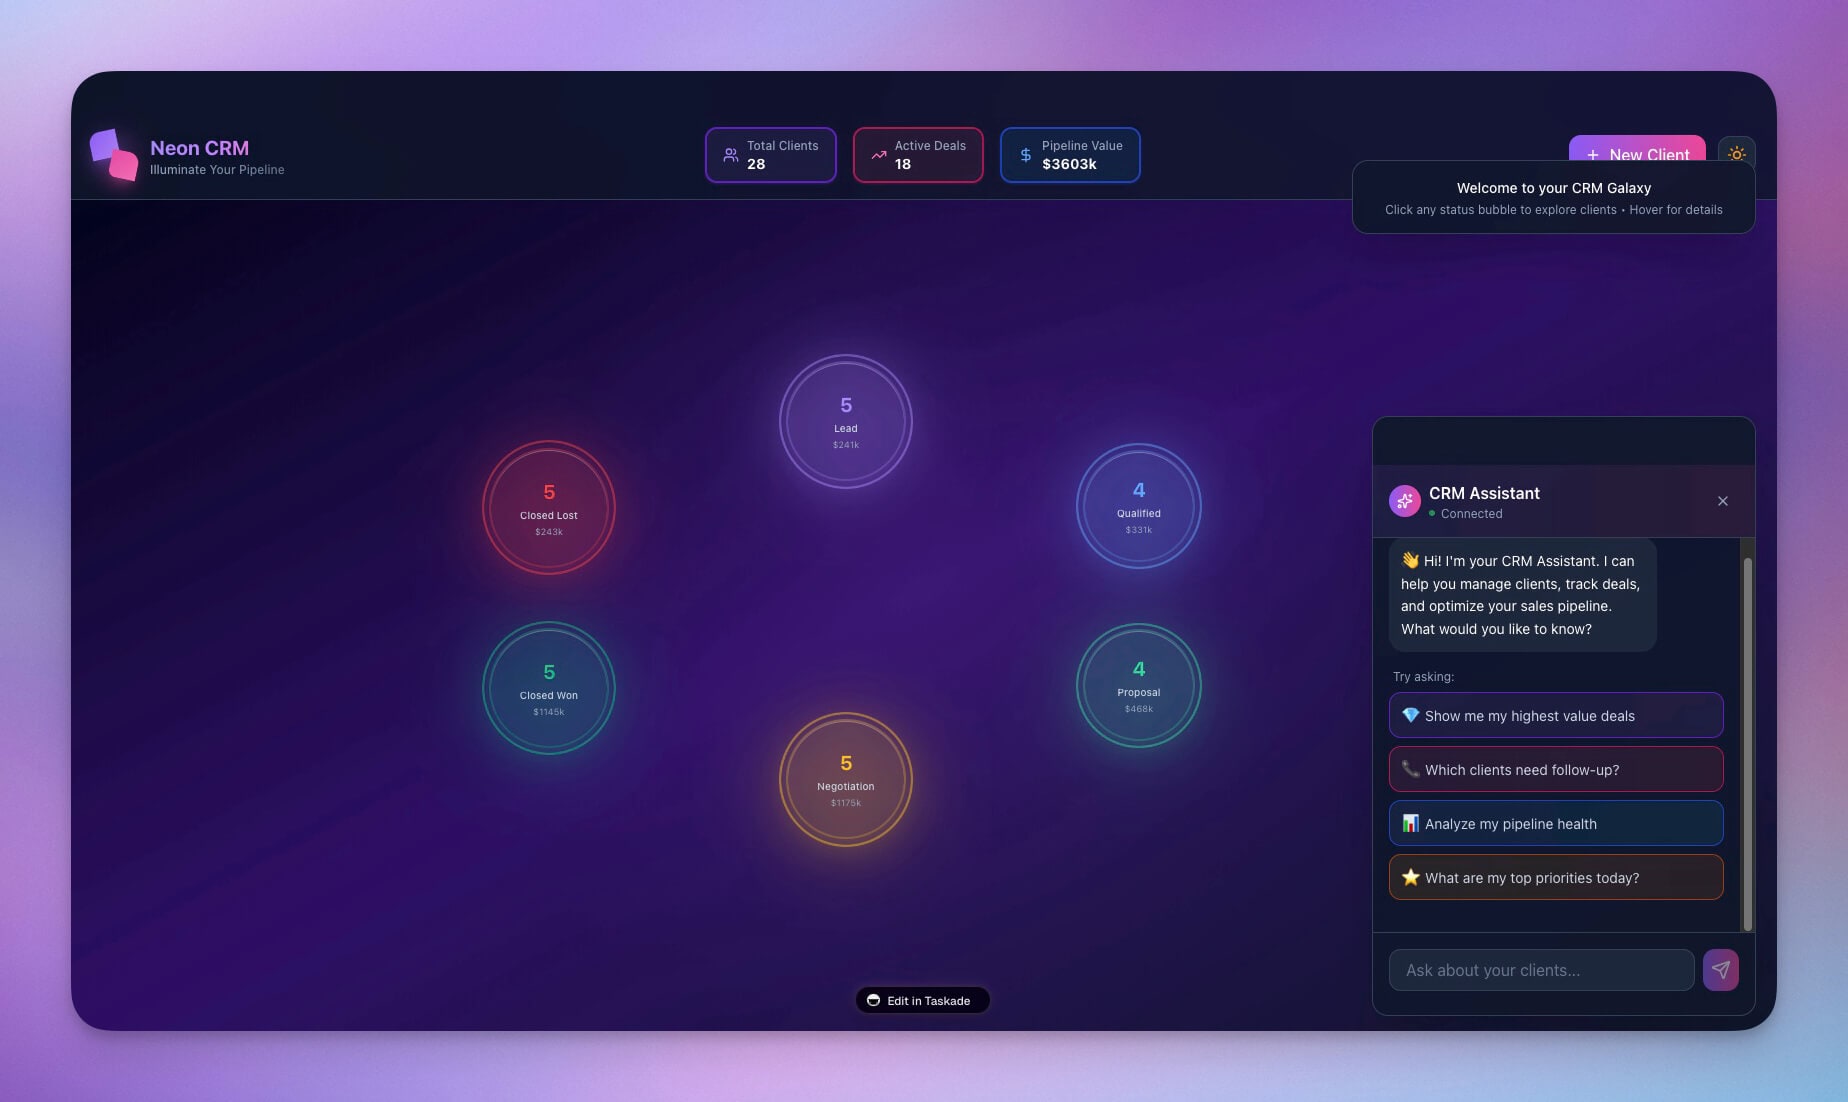
A vibrant CRM interface for tracking leads, deals, and customer relationships. The AI agent analyzes pipeline health and suggests follow-up actions for stalled deals.
Best for: Sales ops, account managers, growth teams
| Feature | Description |
|---|---|
| Lead pipeline | Kanban board with deal stages and weighted values |
| Deal tracking | Stage progression with probability and close date |
| Customer interactions | Call, email, and meeting log tied to contacts |
| Revenue forecasting | AI-calculated weighted pipeline and monthly projections |
| Stale deal alerts | Agent flags deals with no activity for 14+ days |
For a deep dive into how this CRM is structured internally, see The Anatomy of a Genesis App.
How Genesis Ops Dashboards Compare to DevOps Tools
Genesis ops dashboards serve a different purpose than traditional DevOps monitoring tools. Here is where each tool excels.
| Feature | Datadog ($15+/host/mo) | PagerDuty ($21+/user/mo) | Grafana (Free/Cloud) | Taskade Genesis ($6+/mo) |
|---|---|---|---|---|
| Primary use | Infrastructure monitoring | Incident response | Data visualization | Operational management |
| Data source | Server metrics, logs, traces | Alerts from monitoring tools | External time-series databases | Built-in structured databases |
| AI capabilities | Anomaly detection on metrics | AI-assisted incident triage | None (visualization only) | Full AI agents with 34 tools |
| Automations | Alert rules and notifications | Escalation policies and routing | Alert rules (basic) | 100+ integrations, custom chains |
| Business metrics | Limited (technical focus) | None (incident focus) | Yes (with custom queries) | Native support for any business metric |
| Team collaboration | Dashboards and notebooks | Incident timelines | Shared dashboards | Real-time collaboration with 7-tier RBAC |
| Setup time | Hours to days | Hours | Hours to days | Minutes from a prompt |
| Best for | DevOps and SRE teams | On-call engineering teams | Data-heavy technical teams | Business operations and lean teams |
When to use Datadog/PagerDuty/Grafana: Server infrastructure monitoring, incident response, technical metrics visualization.
When to use Taskade Genesis: Business operations management, team capacity planning, maintenance tracking, support quality monitoring, financial operations, investor reporting.
Many teams use both — Datadog for infrastructure and Genesis for business operations. They serve different layers of the operations stack.
Common Ops Automations
Connect your dashboards to real workflows using 100+ integrations. Here are the most common automation patterns for ops teams.
| Automation Type | Trigger | Action | Integration |
|---|---|---|---|
| Threshold alert | Metric crosses limit | Send notification | Slack, Email, Teams |
| Scheduled report | Daily/weekly cadence | Generate and distribute summary | Email, Slack |
| Ticket routing | New ticket created | Assign based on type/priority | Internal (Projects) |
| Status broadcast | Status field changes | Post update to channel | Slack, Discord |
| Calendar sync | Maintenance scheduled | Create calendar event | Google Calendar |
| Escalation | SLA timer expires | Notify manager, bump priority | Slack, Email |
| Data collection | External event via webhook | Create or update record | Webhooks, Zapier |
Each automation is built visually in the automation workflow builder — no code required. Chain multiple actions together for complex operational workflows.
Build Your Own Ops Dashboard
Create a custom ops dashboard in minutes. Here is a structured prompt template.
Build an operations dashboard for [your industry/team] with:DATA:
- [Primary tracking table with specific fields]
- [Secondary table for categories/statuses]
- [History/log table for audit trail]
VIEWS:
- Dashboard summary with key metrics
- [View type] for [specific use case]
- Calendar view for scheduling
INTELLIGENCE:
- AI assistant that answers "[specific question about your data]"
- Identifies [specific patterns or anomalies]
- Suggests [specific actions]
AUTOMATION:
- Alert when [specific condition] is met
- [Daily/weekly] report sent to [channel]
- Auto-route [items] based on [criteria]
Example prompt for a logistics company:
Build an operations dashboard for a logistics company with:DATA:
- Equipment inventory: vehicles, trailers, forklifts with status and location
- Maintenance records: date, type, cost, technician, next due date
- Driver availability: name, shift, certification, current assignment
VIEWS:
- Fleet overview with status indicators
- Maintenance calendar with upcoming service dates
- Driver availability grid by shift
INTELLIGENCE:
- AI assistant that answers "What needs maintenance this week?"
- Identifies equipment with recurring issues
- Suggests optimal maintenance scheduling
AUTOMATION:
- Maintenance due in 7 days: Slack notification to facilities
- Equipment status changes to "out of service": notify dispatch
- Weekly fleet utilization report sent every Monday
Click Enhance Prompt for AI-powered suggestions. Genesis creates the dashboard with Projects, Agents, and Automations — all connected through Workspace DNA.
Learn more: Create Your First App →
Pricing: What Ops Dashboards Cost
| Plan | Monthly Cost (Annual) | Team Size | Ops Use Case |
|---|---|---|---|
| Free | $0 | Individual | Single dashboard, testing |
| Starter | $6/mo | Up to 3 | Small ops team, basic monitoring |
| Pro | $10/mo | Up to 10 | Full ops center with multiple dashboards |
| Business | $25/mo | Unlimited | Company-wide operational management |
Compare that to Datadog ($15/host/month), PagerDuty ($21/user/month), or a custom Grafana Cloud setup. For business operations, Taskade Genesis provides a complete solution at a fraction of the cost.
Start Building Your Ops Center
Clone a dashboard to start immediately:
- Maintenance Tracker — Facilities and fleet
- Team Capacity Planner — Resource management
- Support Rating Dashboard — Customer service quality
- Finance Tracker — Cash flow and budgets
- Neon CRM — Sales pipeline
Learn the fundamentals:
- Create Your First App — Step-by-step tutorial
- Workspace DNA — Architecture overview
- Custom AI Agents — Intelligence layer
- Automation Triggers — Execution layer
- Projects and Databases — Memory layer
Read more:
- 10 AI Dashboards You Can Clone in One Click
- 10 AI Sales and CRM Dashboards
- Build a Business-in-a-Box
- The Anatomy of a Genesis App
- How to Build a Finance Dashboard
- Build Without Permission
- The Origin of Living Software
- From Web Hosting to AI Infrastructure
Explore Taskade AI:
- AI Dashboard Builder — Generate dashboards instantly
- AI App Builder — Build complete apps from one prompt
- AI Workflow Automation — Automate any business process
- Browse Community Apps — 150,000+ apps to clone
Browse dashboard templates:
- Dashboard Templates — 21 ready-to-clone dashboards
- App Templates — Full-featured apps in one click
- Workspace Templates — Complete workspace setups
- All Templates — Explore all categories

Frequently Asked Questions
What is an AI ops dashboard?
An AI ops dashboard is a real-time operations management interface that uses artificial intelligence to track metrics, surface anomalies, and automate responses. Unlike static dashboards, AI ops dashboards built with Taskade Genesis include self-updating data, intelligent agents that monitor KPIs, and automated workflows that trigger actions based on conditions.
How can lean teams benefit from AI-powered dashboards?
Lean teams have limited headcount, so every manual process is a bottleneck. AI ops dashboards automate status tracking, generate reports, alert on issues, and handle routine decisions. With Taskade Genesis, a small team can run operations that would normally require dedicated ops staff -- using AI agents powered by 15+ frontier models from OpenAI, Anthropic, and Google.
What types of operations dashboards can I build with Taskade Genesis?
You can build maintenance trackers, team capacity planners, support rating dashboards, hospitality insight panels, room booking systems, investor dashboards, finance trackers, and CRM dashboards. Each supports 7 project views (List, Board, Calendar, Table, Mind Map, Gantt, Org Chart) and includes AI agents for automated monitoring.
Can I clone an ops dashboard and customize it for my team?
Yes. Every Genesis ops dashboard is cloneable in one click. After cloning, you can modify the database schema, reconfigure AI agents, adjust automation triggers, and set team permissions using 7-tier role-based access control (Owner, Maintainer, Editor, Commenter, Collaborator, Participant, Viewer). The dashboard adapts to your specific operational workflow.
How do Taskade Genesis ops dashboards compare to Datadog?
Datadog is infrastructure monitoring for DevOps teams -- it tracks server metrics, APM traces, and log analytics starting at $15/host/month. Taskade Genesis ops dashboards are operational management tools for business teams -- they track business metrics, team capacity, maintenance schedules, and support quality starting at $6/month. Datadog monitors servers; Genesis manages operations.
How do Taskade Genesis ops dashboards compare to PagerDuty?
PagerDuty is an incident response platform that routes alerts to on-call engineers starting at $21/user/month. Taskade Genesis ops dashboards are broader operational management tools with AI agents, 7 project views, and 100+ integrations for $6/month. PagerDuty handles incident routing; Genesis handles full operational workflows including capacity planning, maintenance tracking, and reporting.
How do Taskade Genesis ops dashboards compare to Grafana?
Grafana is a data visualization platform that connects to time-series databases for technical monitoring. Taskade Genesis ops dashboards are self-contained operational management systems with built-in databases, AI agents that analyze data and suggest actions, and automated workflows. Grafana visualizes existing data; Genesis creates the entire operational system from a prompt.
What automations can I add to an ops dashboard?
Ops dashboards support Slack alerts when metrics cross thresholds, email summaries sent daily or weekly to stakeholders, ticket routing based on priority or type, status updates posted automatically to project channels, calendar sync for maintenance schedules, and custom webhook integrations. All automations use Taskade's 100+ integrations.
What is the best way to build a custom ops dashboard from scratch?
Describe your operational needs in a structured prompt with four sections: Data (what metrics and records to track), Views (how you want to see the data), Intelligence (what the AI agent should monitor and analyze), and Automation (what should happen when conditions are met). Click Enhance Prompt for AI suggestions, then Generate. The entire process takes minutes.
Can multiple team members use the same ops dashboard simultaneously?
Yes. Taskade supports real-time collaboration with 7-tier role-based access control. Ops managers get Editor access to update records, executives get Viewer access for read-only dashboards, and team leads get Commenter access to add context. All changes sync in real-time across all connected users.