


Let us build something real.
The Finance Tracker Dashboard is one of our most cloned templates — and it took 10 minutes to build from scratch. No code. No spreadsheet formulas. No accounting degree.
This tutorial walks through exactly how we did it. Follow along and build your own.
TL;DR: Build a complete finance dashboard with AI-powered spending analysis,
automated budget alerts, and cash flow tracking — all from one prompt in Taskade
Genesis. 10 minutes, zero code. 150,000+ apps already built this way.
Start building →
What You Will Build
A fully functional finance dashboard that tracks expenses and revenue, categorizes transactions automatically with AI, shows cash flow trends across multiple views, alerts you when budgets exceed thresholds, and summarizes your finances on demand.
| Capability | What It Does | Powered By |
|---|---|---|
| Transaction tracking | Records income and expenses with categories | Memory (Projects) |
| Budget monitoring | Alerts at configurable thresholds (e.g., 80%) | Execution (Automations) |
| Spending analysis | Answers "What did I spend on food?" in natural language | Intelligence (AI Agent) |
| Trend visualization | Monthly comparison charts and category breakdowns | 7 project views |
| Weekly summaries | Formatted digest of spending by category, sent on schedule | Automations |
| Auto-categorization | Suggests categories for new transactions | AI Agent with 34 tools |
Time required: 10 minutes
Skills needed: None (just typing)
Cost: Free plan to start, $6/month for Starter
Time Breakdown: 10 Minutes Start to Finish
| Step | What Happens | Time | Layer |
|---|---|---|---|
| 1 | Write the prompt | 2 min | You |
| 2 | AI generation | 1 min | Genesis |
| 3 | Schema review | 2 min | Memory |
| 4 | Add sample data | 2 min | Memory |
| 5 | Test the AI agent | 2 min | Intelligence |
| 6 | Test automations | 1 min | Execution |
| Total | Complete dashboard | ~10 min | All three layers |
This 10-minute build produces a dashboard that would take days to build in a spreadsheet and weeks to build as a custom application. Let us walk through each step.
Step 1: Write the Prompt (2 Minutes)
The quality of your prompt determines the quality of your dashboard. We used a structured prompt with four sections: Data, Views, Intelligence, and Automation.
Prompt
Build a personal finance tracker dashboard with:DATA:
- Transactions table: date, description, amount, category, type (income/expense)
- Categories: Food, Transport, Housing, Entertainment, Health, Income, Other
- Budget limits per category
VIEWS:
- Dashboard view showing total income, expenses, and balance
- Transaction list with filters
- Category breakdown chart
- Monthly trend view
INTELLIGENCE:
- AI assistant that can answer questions about spending
- Categorize new transactions automatically
- Identify unusual spending patterns
AUTOMATION:
- Alert when category budget exceeds 80%
- Weekly spending summary email
- Monthly report generation
The prompt follows a pattern: define your data structure first (what you want to track), then your views (how you want to see it), then your intelligence (what questions you want answered), then your automations (what should happen automatically).
Click Enhance Prompt to let Genesis suggest improvements — it often adds useful features like receipt uploads or multi-currency support that you had not considered.
Step 2: Generation (1 Minute)
We clicked Generate and watched Genesis build the entire system. Here is what was created automatically in under 60 seconds.
Projects created:
- Transactions — main data table with all transaction fields
- Categories — category definitions with budget limits and display colors
- Monthly Summaries — aggregated monthly data for trend analysis
Views created:
- Dashboard — summary cards showing total income, expenses, and balance
- Transactions — filterable list view of all records
- Categories — budget vs. actual spending by category
- Trends — monthly comparison charts
Agent created:
- Finance Assistant — trained on your transaction data with 34 built-in tools
- Answers "What did I spend on food this month?"
- Suggests categorizations for new entries
- Identifies spending anomalies and patterns
Automations created:
- Budget Alert — triggers when any category reaches 80% of its limit
- Weekly Summary — generates and sends a formatted digest every Sunday
- Auto-Categorize — suggests category for every new transaction entry
All built automatically from the prompt. No configuration needed.
Step 3: Schema Review (2 Minutes)
We reviewed the generated schema to make sure the data structure matched our needs. Genesis created two tables with the following fields.
Transactions Table
| Field | Type | Purpose |
|---|---|---|
| date | Date | When the transaction occurred |
| description | Text | What the transaction was for |
| amount | Number | Dollar amount (positive for both income and expense) |
| category | Relation to Categories | Links to spending category |
| type | Select (income/expense) | Transaction direction |
Categories Table
| Field | Type | Purpose |
|---|---|---|
| name | Text | Category name (Food, Transport, etc.) |
| budget | Number | Monthly budget limit in dollars |
| color | Select | Display color for charts and views |
We made one adjustment: added a notes field to Transactions for additional context like receipt numbers or merchant details. This took 30 seconds — click the table, add field, name it, done.
The schema supports all 7 project views — List, Board, Calendar, Table, Mind Map, Gantt, and Org Chart. The Calendar view is particularly useful for spotting spending clusters by date.
Learn more about projects and databases →
Step 4: Adding Sample Data (2 Minutes)
To test the dashboard, we added five sample transactions and four category budgets.
Sample Transactions
| Date | Description | Amount | Category | Type |
|---|---|---|---|---|
| Jan 1 | Salary | $5,000 | Income | income |
| Jan 2 | Grocery Store | $150 | Food | expense |
| Jan 3 | Gas Station | $45 | Transport | expense |
| Jan 5 | Netflix | $15 | Entertainment | expense |
| Jan 7 | Restaurant | $65 | Food | expense |
Category Budgets
| Category | Monthly Budget |
|---|---|
| Food | $500 |
| Transport | $200 |
| Entertainment | $100 |
| Housing | $1,500 |
The dashboard immediately populated with charts and summaries. The balance card showed $4,725 remaining. The category breakdown showed Food at 43% of budget. The trend view showed spending patterns by day.
You can enter data manually, paste from a spreadsheet, or let the AI agent help categorize entries as you add them.
Step 5: Testing the Agent (2 Minutes)
The Finance Assistant agent is the intelligence layer of the dashboard. We tested it with three different types of questions.
Spending summary query:
- Input: "What is my total spending this month?"
- Response: "You have spent $275 this month across 4 transactions. Food is your largest category at $215 (43% of your $500 budget)."
Budget check query:
- Input: "Am I over budget anywhere?"
- Response: "You are currently under budget in all categories. Food is at 43%, Transport at 23%, and Entertainment at 15%."
Categorization query:
- Input: "Categorize: Amazon Books for $25"
- Response: "I would categorize this as Entertainment. Would you like me to add it?"
The agent understood our data schema, calculated percentages correctly, and offered to take action. This is the Intelligence layer of Workspace DNA — agents that reason about your Memory (data) and can trigger Execution (automations).
The Finance Assistant is powered by 15+ frontier models from OpenAI, Anthropic, and Google, with persistent memory that remembers your spending patterns across sessions.
Step 6: Testing Automations (1 Minute)
We tested the budget alert automation by adding enough expenses to push the Food category past 80%.
- Added a $200 grocery expense to push Food to 85% ($425 of $500)
- Automation triggered immediately
- Alert appeared: "Food budget at 85% ($425 of $500)"
We also previewed the weekly summary automation — a formatted digest of spending by category with totals, percentages, and trend comparisons to the previous week.
Automations connect to 100+ integrations including Slack, email, Google Calendar, and webhooks. You can send budget alerts to a Slack channel, email weekly summaries to your accountant, or trigger custom workflows when specific conditions are met.
Learn more about automation triggers →
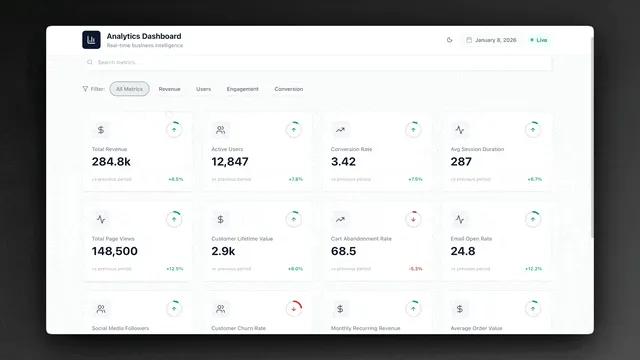
The Final Dashboard
After 10 minutes, we had a complete finance management system.
| Component | Status | Description |
|---|---|---|
| Data structure | Complete | Transactions and Categories tables with relations |
| Multiple views | 7 available | Dashboard, list, categories, trends, calendar, board, mind map |
| AI assistant | Active | Answers spending questions, suggests categories |
| Budget alerts | Configured | Triggers at 80% threshold for all categories |
| Weekly reports | Scheduled | Sends digest every Sunday |
| Shareable URL | Live | Accessible from any device |
![]()
Clone Finance Tracker Dashboard →
How This Compares to Traditional Finance Tools
The Genesis finance dashboard is not a replacement for full accounting software — it is a replacement for the operational dashboards that help you make daily financial decisions.
| Feature | QuickBooks ($30+/mo) | Wave (Free) | Taskade Genesis ($6+/mo) |
|---|---|---|---|
| Setup time | Hours to days | Hours | 10 minutes |
| Tax preparation | Full tax support | Basic tax reports | Not designed for tax prep |
| AI spending analysis | Limited AI features | No AI | Full AI agent with 34 tools |
| Custom automations | Basic rules | No automations | 100+ integrations, custom chains |
| Budget alerts | Manual threshold setup | Email alerts | AI-powered threshold monitoring |
| Natural language queries | No | No | "What did I spend on food?" |
| Project views | Fixed dashboard | Fixed dashboard | 7 views (List, Board, Calendar, Table, Mind Map, Gantt, Org Chart) |
| Team access control | Role-based | Limited roles | 7-tier RBAC (Owner to Viewer) |
| Custom domains | No | No | Built-in with automatic SSL |
| Coding required | No | No | No |
When to use QuickBooks or Wave: Tax compliance, payroll, professional bookkeeping, bank reconciliation.
When to use Taskade Genesis: Real-time cash flow monitoring, AI-powered spending analysis, automated budget alerts, team financial operations, cross-system integrations.
Many teams use both — QuickBooks for accounting compliance and Taskade for daily financial operations and decision-making.
Customization Ideas: Extend Your Dashboard
After building the base dashboard, you can extend it with additional prompts. Each addition takes seconds.
| Extension | Prompt Example | What It Adds |
|---|---|---|
| Income sources | "Add income source tracking with employer, freelance, and investment categories" | Breakdown of where money comes from |
| Savings goals | "Add savings goals with target amounts, deadlines, and progress tracking" | Visual progress toward financial targets |
| Bill tracking | "Add recurring bill tracking with due dates and auto-pay status" | Never miss a payment |
| Multi-currency | "Add multi-currency support with USD, EUR, and GBP conversion" | International transaction tracking |
| Receipt uploads | "Add receipt image uploads linked to each transaction" | Paperless expense documentation |
| Forecast | "Add 3-month spending forecast based on historical patterns" | AI-predicted budget needs |
Each extension adds new fields to your schema, updates the AI agent's knowledge, and configures new automations — all from a single prompt.
Build Your Own Finance Dashboard
Ready to build your own? Here is the fastest path.
- Open Taskade Genesis and click "Create App"
- Copy our prompt from Step 1 above (or write your own)
- Click Enhance Prompt for AI suggestions
- Click Generate — takes about 60 seconds
- Review the schema and adjust fields if needed
- Add your data (or paste from a spreadsheet)
- Test the AI agent and automations
- Share with your team or publish to a custom domain
Learn more: Create Your First App →
Resources
Clone the finished version:
Related templates:
Learn the fundamentals:
- Workspace DNA — Architecture overview
- Projects and Databases — Memory layer
- Custom AI Agents — Intelligence layer
- Automation Triggers — Execution layer
- Custom Domains — Publishing your dashboard
Explore more tutorials:
- How to Build a Simple Store Manager
- How to Build a QR Code Generator
- How to Build a Room Booking Dashboard
- Build a Business-in-a-Box
- 10 AI Finance Workspaces for Founders
Explore Taskade AI:
- AI App Builder — Build complete applications
- AI Dashboard Builder — Generate dashboards
- AI Workflow Automation — Automate any business process
- Browse Community Apps — 150,000+ apps to clone
Explore the Vibe Apps series:
- Vibe Calculator Apps — 10 AI calculators you can build without code
- Vibe Finance Apps — AI invoice generators, expense trackers, and dashboards

Frequently Asked Questions
How long does it take to build a finance dashboard with Taskade Genesis?
About 10 minutes total. The breakdown is: 2 minutes writing the prompt, 1 minute for AI generation, 2 minutes reviewing the schema, 2 minutes adding sample data, 2 minutes testing the AI agent, and 1 minute testing automations. No coding skills are needed.
What does the Taskade Finance Tracker Dashboard include?
The dashboard includes a transactions database with expense categorization, multiple views (dashboard summary, transaction list, category breakdown, monthly trends), an AI Finance Assistant that answers questions about your spending, automated budget alerts at customizable thresholds, and scheduled weekly summary reports.
Can the AI agent in Taskade answer questions about my spending?
Yes. The Finance Assistant AI Agent is trained on your transaction data and can answer questions like 'What did I spend on food this month?' or 'Am I over budget anywhere?' It can also suggest categories for new transactions and identify unusual spending patterns, powered by 15+ frontier AI models from OpenAI, Anthropic, and Google.
What automations does the finance dashboard support?
The dashboard includes budget threshold alerts (triggered when spending reaches a set percentage like 80%), weekly spending summary emails sent on schedule, and automatic transaction categorization suggestions. You can add more automations using Taskade's 100+ integrations with services like Slack, email, and calendar apps.
How does the Taskade finance dashboard compare to QuickBooks?
QuickBooks is a full accounting suite designed for tax prep, payroll, and bookkeeping -- it starts at $30/month and requires accounting knowledge. The Taskade Genesis finance dashboard is a real-time cash flow and budget tracker built in minutes from a prompt, starting at $6/month. It includes AI agents that analyze your spending and automations that alert you when budgets exceed thresholds.
How does the Taskade finance dashboard compare to Wave?
Wave is free accounting software focused on invoicing and bookkeeping for freelancers. The Taskade Genesis finance dashboard is a customizable operations tracker with AI analysis, automated alerts, and 7 project views (List, Board, Calendar, Table, Mind Map, Gantt, Org Chart). Wave handles tax compliance; Taskade handles real-time financial operations and decision-making.
Can I customize the finance dashboard after building it?
Yes. Every part of the dashboard is editable. You can modify the database schema (add fields, change types), reconfigure the AI agent personality and capabilities, adjust automation triggers and thresholds, and change views. The dashboard supports 7 project views and 7-tier access control (Owner, Maintainer, Editor, Commenter, Collaborator, Participant, Viewer).
What data fields does the finance dashboard track?
The default schema tracks transaction date, description, amount, category (Food, Transport, Housing, Entertainment, Health, Income, Other), and type (income or expense). Each category has a budget limit. You can add custom fields like notes, receipt uploads, multi-currency support, and savings goals.
Can I share the finance dashboard with my team?
Yes. Every Genesis app gets a shareable URL. You can publish it with custom domain support and password protection, or share it within your Taskade workspace using 7-tier role-based access control. Finance managers get Editor access while stakeholders get Viewer access.
What is the best way to write a prompt for a finance dashboard?
Include specific details: data fields (date, amount, category, type), views you want (dashboard summary, transaction list, trend charts), AI agent capabilities (spending analysis, categorization), and automation triggers (budget alerts, weekly reports). The more specific the prompt, the better the result. Use the Enhance Prompt feature to let Genesis suggest improvements.