


Every business runs on data. But turning that data into actionable insights? That used to require analysts, developers, and expensive BI tools.
Not anymore.
AI dashboard builders let you create professional analytics dashboards by simply describing what you want to see. Track KPIs, visualize trends, monitor operations—all without writing SQL queries or configuring complex tools.
TL;DR: The business intelligence market hit $38.15 billion in 2025 and is growing at 8.17% CAGR. AI dashboard builders are the fastest-growing segment — Taskade Genesis creates living dashboards with embedded AI agents and automations from a single prompt, starting at $10/month (annual billing). Try it free →
We've tested the leading AI dashboard platforms to help you find the right one for your needs. Whether you're a startup founder tracking metrics or an enterprise team building reporting systems, this guide has you covered.
⚡ Why AI Dashboard Builders Are Essential in 2026
The business intelligence market reached $38.15 billion in 2025 and is projected to hit $56.28 billion by 2030 according to Mordor Intelligence. The fastest growth is in AI-powered analytics, where natural language interfaces are replacing SQL queries and drag-and-drop builders.
Here is why the shift matters:
The Old Way (Traditional BI):
- Hire data analysts ($80-150K/year)
- Learn complex tools like Tableau or Power BI (weeks of training)
- Write SQL queries for every custom report
- Wait for IT to connect data sources and configure pipelines
- Pay $42-75/user/month for creator licenses
The New Way (AI Dashboard Builders):
- Describe the dashboard you need in plain English
- AI connects to your data sources automatically
- Get working visualizations in 2-15 minutes
- Ask follow-up questions in natural language
- Flat pricing starting at $10/month (annual billing)
According to ThoughtSpot's 2026 enterprise guide, the future of BI lies in "AI-driven, instant analytics that work within your existing workflows." Instead of visiting separate dashboards or submitting data support tickets, teams get trusted and governed insights delivered wherever they work.
Here is what modern AI dashboard builders deliver:
- 🧠 Natural language queries: "Show me sales by region this quarter" returns a chart, not a query editor
- 📊 Automatic visualizations: AI chooses the right chart type based on your data structure
- 🔄 Real-time updates: Dashboards refresh with live data from 100+ integrations
- 🔗 Easy data connections: Point-and-click or prompt-based integrations — you can also convert files and data into dashboard-ready formats
- 🤖 AI insights: Automatic trend detection, anomaly alerts, and plain-English explanations
- 🔒 Built-in governance: Role-based access, audit trails, and data security
The best AI dashboards don't just display data—they help you understand it and act on it.
📊 Quick Comparison: AI Dashboard Builders at a Glance
| Tool | Starting Price | AI Capabilities | Best For | Deployment |
|---|---|---|---|---|
| Taskade Genesis | Free / $10/mo | Vibe coding + embedded AI agents + automations | Teams wanting living dashboards | Instant (one-click) |
| Tableau | $15/user/mo | Tableau Agent, Pulse, Einstein Copilot | Enterprise analytics teams | Self-hosted or Cloud |
| Power BI | Free / $14/user/mo | Copilot AI, natural language Q&A, DAX assist | Microsoft ecosystem orgs | Cloud + Desktop |
| Metabase | Free (OSS) / $100/mo | Metabot NL queries, X-ray analysis | Technical teams, developers | Self-hosted or Cloud |
| Looker | Free (Studio) / $66K+/yr | Gemini AI, conversational analytics, LookML assist | Google Cloud customers | Cloud only |
| ThoughtSpot | $25/user/mo | Spotter AI agent, SpotIQ anomaly detection | NLQ-first organizations | Cloud only |
| Klipfolio | $49/mo | Pre-built connectors, KPI tracking (no AI) | Marketing/operations teams | Cloud only |
| Domo | ~$50K+/yr | NL analytics, AI data prep | Enterprise data platforms | Cloud only |
| Databox | $159/mo | Genie AI analyst, forecasts, anomaly detection | Marketing/SaaS teams | Cloud only |
| Geckoboard | $60/mo | TV display mode, status indicators (no AI) | Always-on team displays | Cloud only |
🏆 The 10 Best AI Dashboard Builders in 2026
#1 Taskade Genesis ⭐
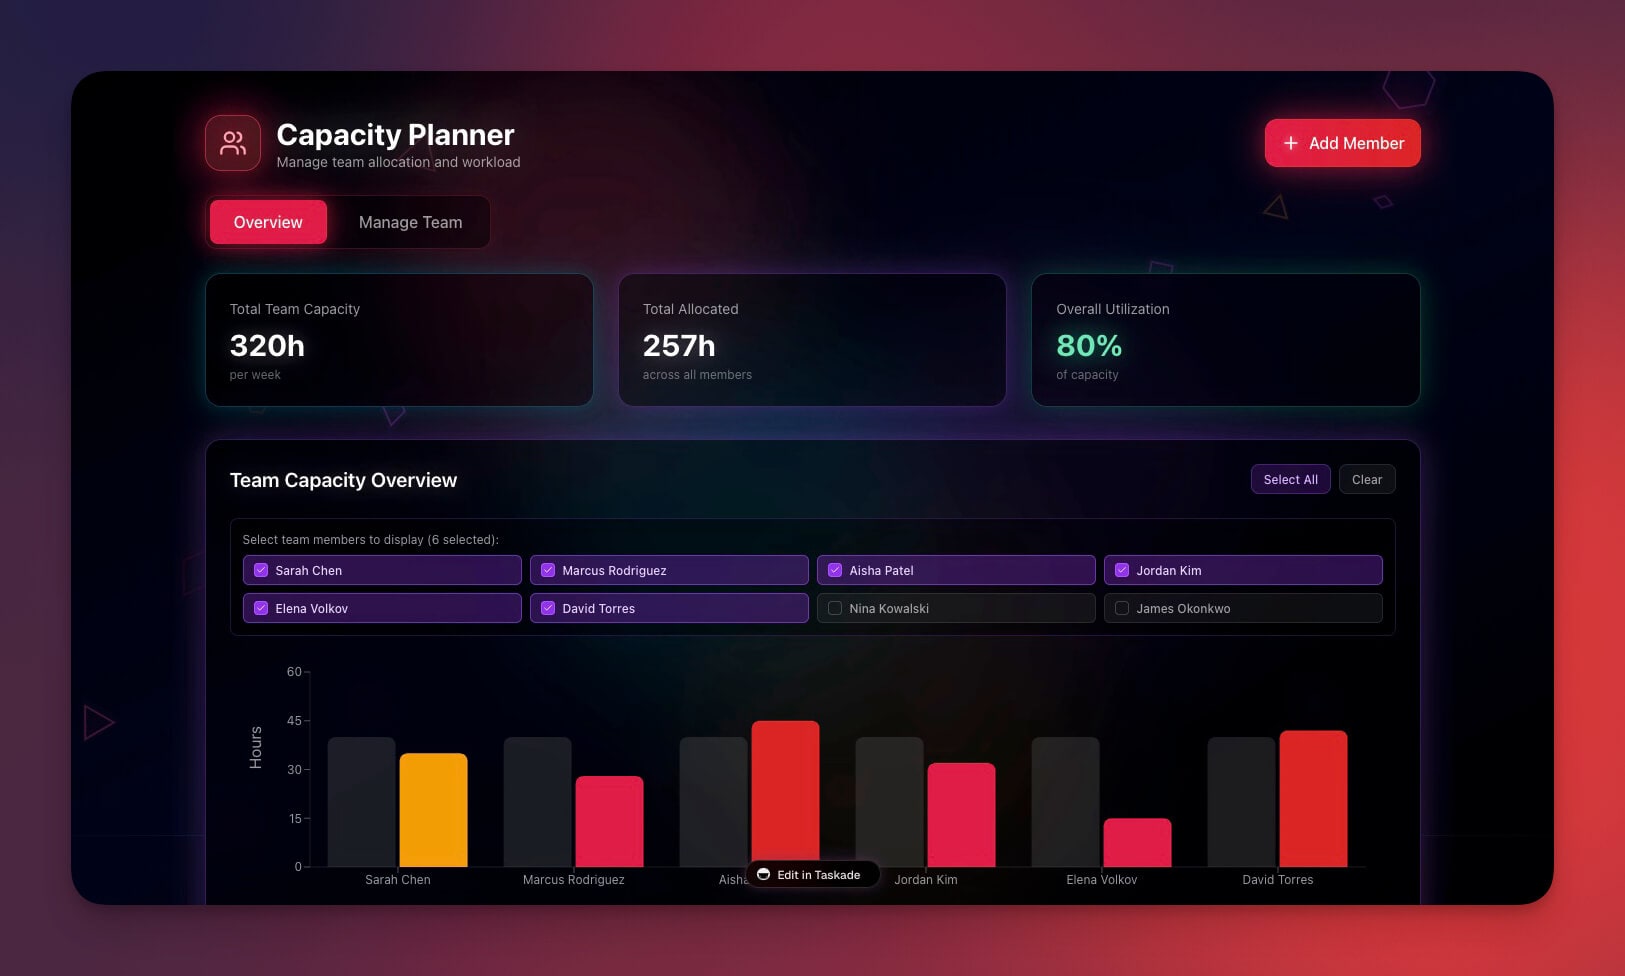
Taskade Genesis is the only dashboard builder that creates living systems — dashboards with embedded AI agents, automations, and workspace-native data. Traditional BI tools connect to external databases. Genesis dashboards are powered by Workspace DNA: your projects remember, your agents analyze, and your automations act.
Using vibe coding, you describe the dashboard you need in plain English, and Genesis creates a fully functional, interactive dashboard in 2-15 minutes. No SQL, no data modeling, no weeks of configuration.
How Workspace DNA Powers Dashboards
Every Taskade Genesis dashboard inherits three layers of intelligence:
| Layer | What It Does | Dashboard Example |
|---|---|---|
| 🧠 Memory (Projects) | Structured databases with custom fields and table views | Sales pipeline data automatically feeds dashboard charts |
| 🤖 Intelligence (AI Agents) | Custom-trained agents with 34 built-in tools | An embedded agent explains why revenue dipped last Tuesday |
| ⚡ Execution (Automations) | production-grade workflows with 100+ integrations | Slack alert fires when any KPI crosses a threshold |
This is the fundamental difference. Tableau displays data. Power BI visualizes data. Genesis dashboards understand and act on data.
What You Can Build
- 💰 Finance tracking dashboards with automated budget alerts
- 👥 Team capacity planners with agent-powered recommendations
- 📈 Sales and CRM dashboards with pipeline intelligence
- 🎫 Support ticket analytics with automated escalation
- 📊 Project management overviews across 7 views (List, Board, Calendar, Table, Mind Map, Gantt, Org Chart)
- 🏢 Operational KPI trackers with real-time Stripe, HubSpot, and Google Sheets integrations
Taskade Genesis Features 🌟
| Feature | Description |
|---|---|
| 🧬 Vibe Coding | Describe dashboards in natural language — learn more |
| 🤖 Embedded AI Agents | Agents trained on your data answer questions inside the dashboard |
| 💾 Workspace DNA | Projects, agents, and automations power every visualization |
| ⚡ Live Automations | Alerts and actions triggered by metric changes |
| 📱 Mobile Responsive | Dashboards render on any device (Tailwind CSS, mobile-first) |
| 🎨 Custom Domains | Publish dashboards to your own .com, .app, or .dev domain |
| 🔄 Real-time Updates | Data refreshes automatically as workspace changes |
| 👥 7-Tier RBAC | Owner, Maintainer, Editor, Commenter, Collaborator, Participant, Viewer |
| 🌍 100+ Integrations | Pull data from Stripe, HubSpot, Slack, GitHub, and more |
| 📊 7 Project Views | Visualize the same data as List, Board, Calendar, Table, Mind Map, Gantt, Org Chart |
Example: Building a Finance Dashboard
"Create a finance dashboard showing monthly expenses by category,
income trends, budget vs actual, and a summary of outstanding invoices.
Add an AI agent that explains spending patterns. Alert me on Slack
when any category exceeds budget by 10%."
Genesis creates a complete finance dashboard with charts, tables, an embedded AI analyst, and automated budget alerts — in under 5 minutes. A traditional BI tool would need a data analyst, SQL queries, dashboard design, and a separate Zapier automation for alerts.
| What | Traditional BI | Taskade Genesis |
|---|---|---|
| Time to first dashboard | 2-4 weeks | 2-15 minutes |
| Skills required | SQL, data modeling, BI training | Plain English |
| AI built in | Add-on ($10-20/user extra) | Included (15+ models) |
| Automations | Separate tool (Zapier $20+/mo) | Built-in, production-grade |
| Cost for team of 10 | $420-750/mo (Tableau) | $10/mo (Pro, 10 users included) |
Clone These Taskade Genesis Dashboards
| Type | Live Example |
|---|---|
| 💰 Finance | Finance Tracker Dashboard |
| 📈 Investor | Investor Dashboard |
| 🏨 Hospitality | Hospitality Insight Dashboard |
| 👥 Team | Team Capacity Planner |
| 🎫 Support | Support Rating Dashboard |
| ✅ Tasks | Neon Task Management Dashboard |
| 📊 Projects | Monochrome Project Dashboard |
Taskade Genesis Pricing 💸
| Plan | Price | What You Get |
|---|---|---|
| 🟢 Free | $0 | 3 apps, core AI, up to 3,000 AI credits |
| 🟣 Pro | $10/month (annual, 10 users) | Unlimited agents and automations, live web hosting, background agents, 50K credits/mo |
| 🟡 Business | $25/month (annual) | Unlimited users, white-label, hourly knowledge sync, 150K credits/mo |
| 🏢 Enterprise | Custom | SLA, real-time knowledge sync, dedicated support |
What makes Taskade Genesis dashboards different from every other tool on this list:
Your dashboards don't just display data. They think about it and act on it. Embedded AI agents analyze trends, answer questions in natural language ("what caused the sales dip last week?"), and trigger automations when thresholds are crossed. Background agents (Pro+) monitor your dashboards around the clock and alert your team via Slack, email, or Telegram.
Publish dashboards with shareable links (Pro+) or your own custom domain (Business+). Share with clients or clone across teams.
Clone these dashboard apps:
| Use Case | App | Clone |
|---|---|---|
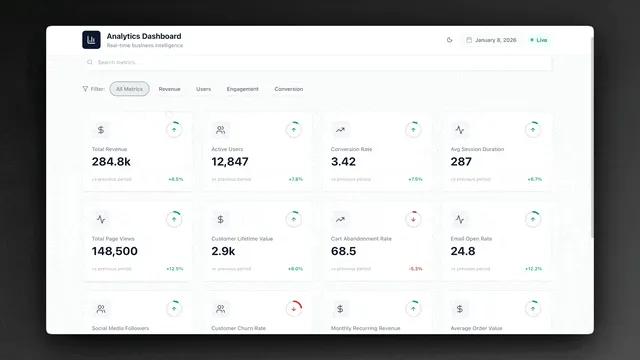
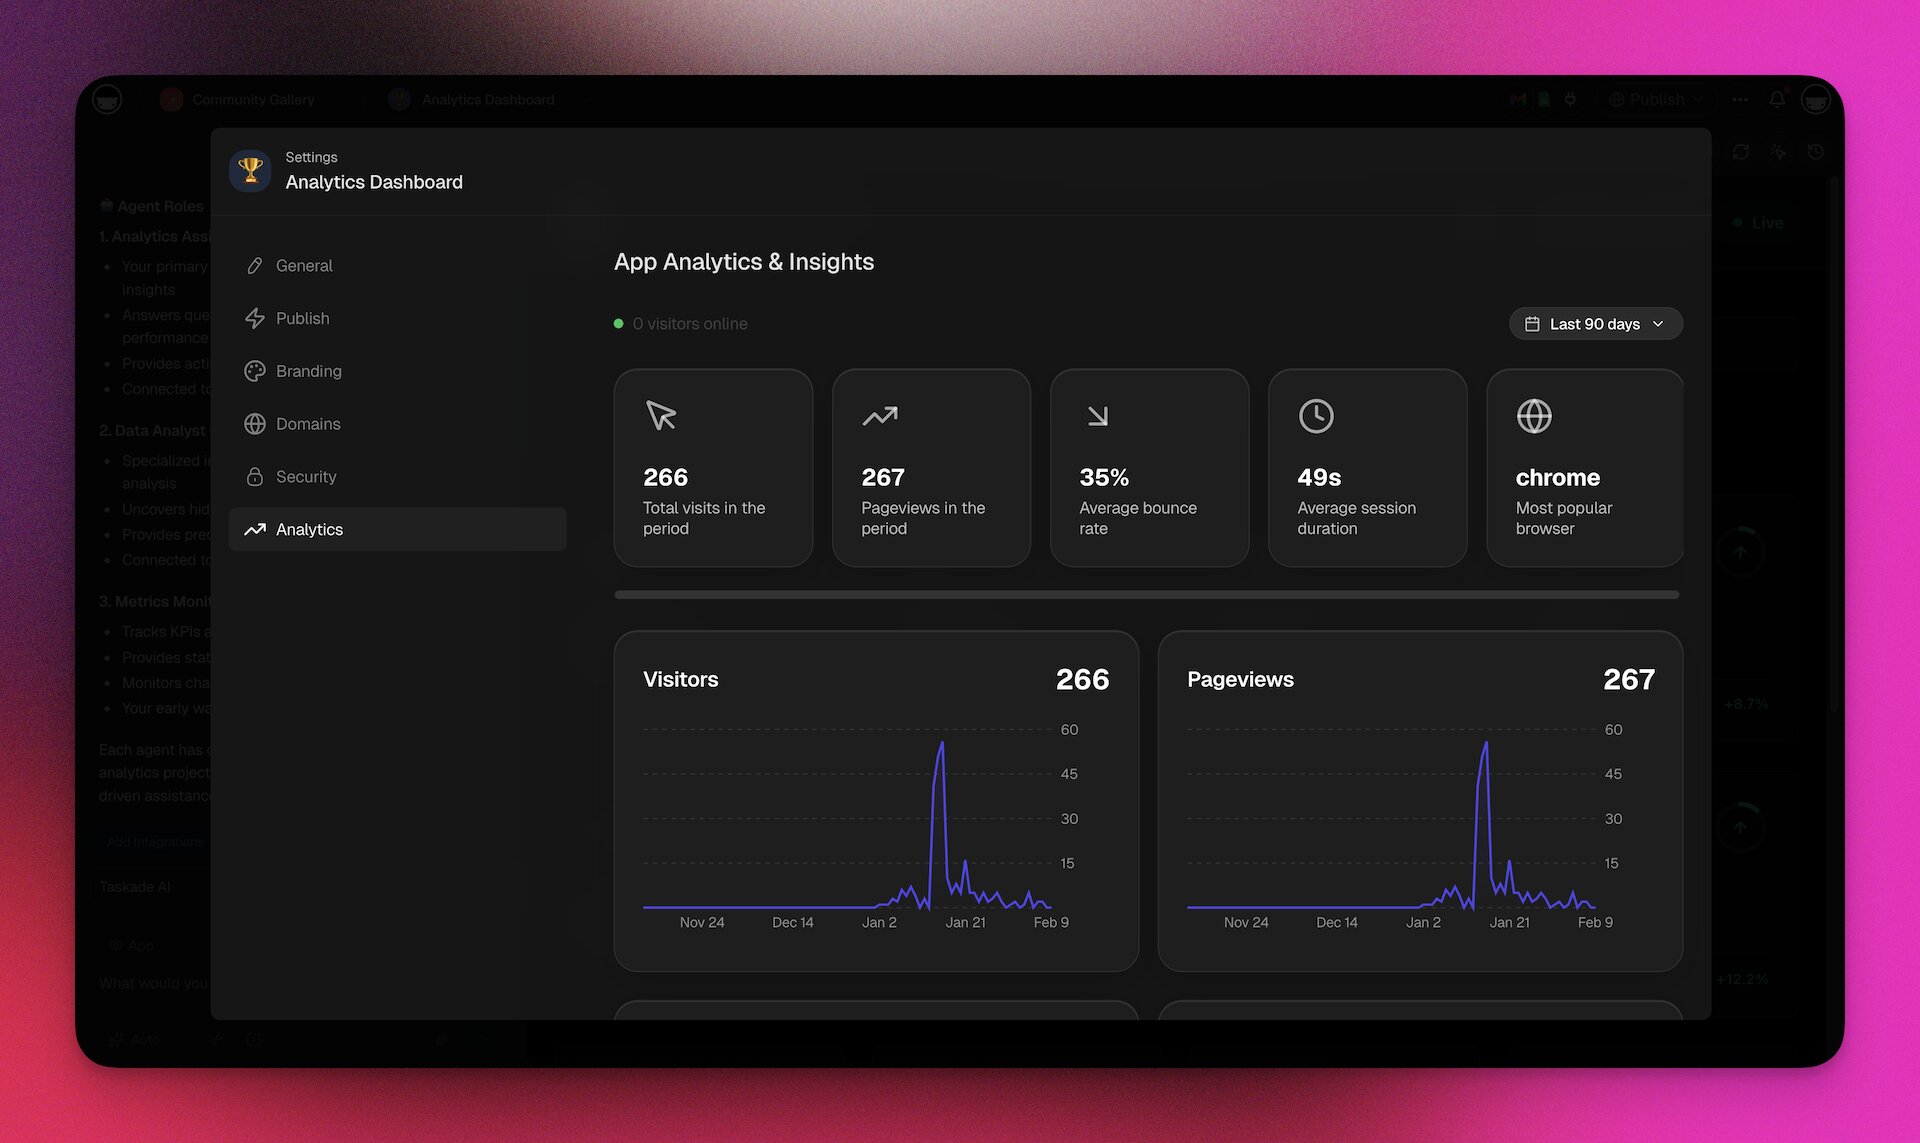
| Business analytics | Analytics Dashboard | Clone → |
| Growth metrics | Growth Dashboard | Clone → |
| Financial overview | Finance Tracker Dashboard | Clone → |
| Customer health | Customer Health Dashboard | Clone → |
| Support quality | Support Rating Dashboard | Clone → |
The honest catch: Taskade Genesis dashboards use your workspace as the data source, with 100+ integrations pulling data from Stripe, HubSpot, Google Sheets, Shopify, and more. If your data lives exclusively in a cloud data warehouse (Snowflake, BigQuery), a traditional BI tool may be a better fit. But for operational dashboards, team metrics, and project reporting, Taskade Genesis eliminates weeks of setup.
👉 Create your first dashboard with Genesis →
👉 Browse dashboard templates →
#2 Tableau (with Einstein AI)
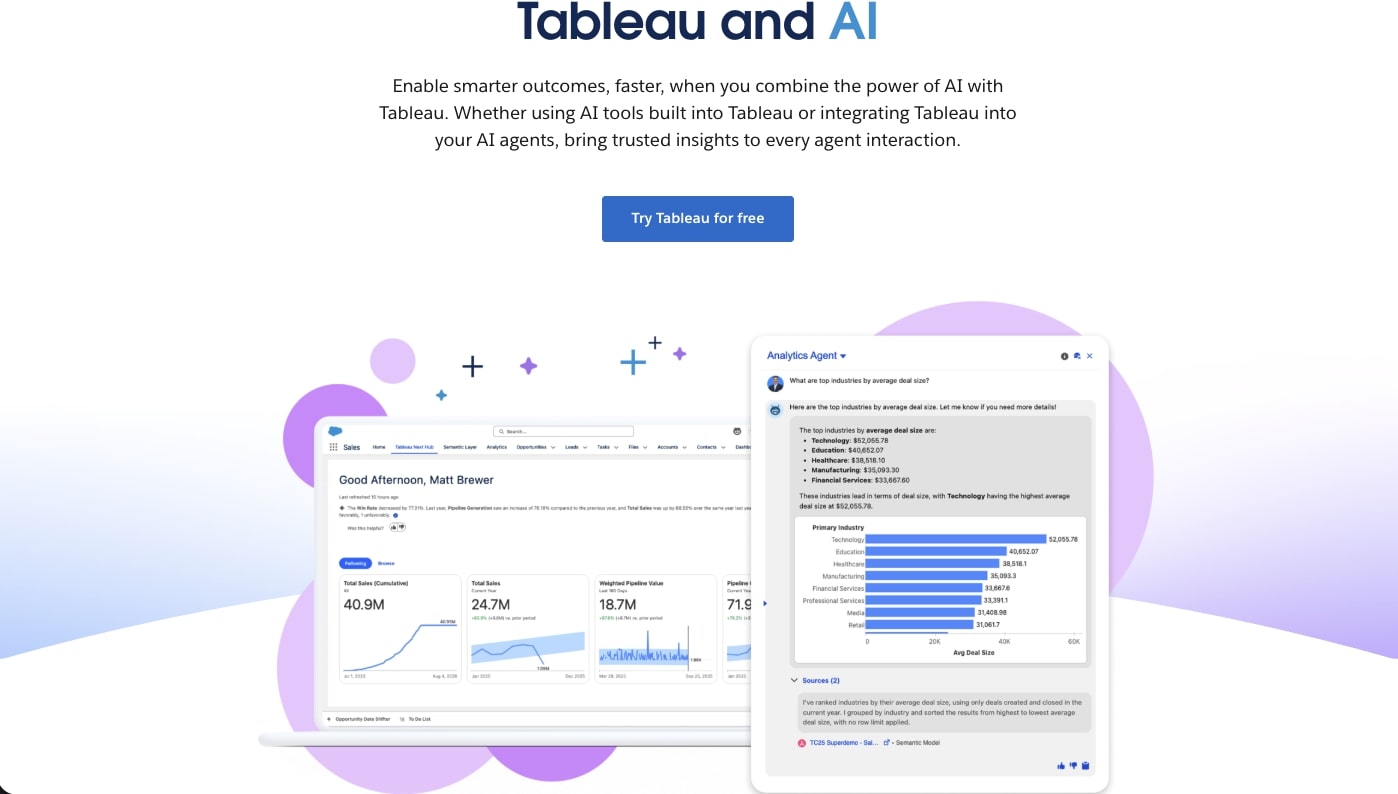
Tableau remains the gold standard for enterprise data visualization, with Salesforce reporting over 150,000 customer organizations worldwide. The 2025-2026 Tableau+ rebrand adds Einstein Copilot (generative AI for dashboards), Tableau Pulse (proactive metric monitoring), and Tableau Agent (autonomous data analysis) — moving Salesforce's BI strategy from self-serve dashboards toward AI-driven insights.
The platform handles petabyte-scale datasets with a visualization library unmatched in depth: 24 chart types, statistical models, spatial analytics, and a robust calculation engine. Tableau Prep provides drag-and-drop data preparation, and Tableau Public lets you publish interactive visualizations to the web for free.
What Einstein AI Adds
Tableau's AI layer has matured significantly since the 2024 relaunch:
- Tableau Agent — An autonomous AI that answers complex multi-step analytical questions by chaining queries, joining data sources, and building visualizations without human intervention
- Einstein Copilot — Generates calculated fields, writes LOD expressions, and suggests chart types based on your data structure
- Tableau Pulse — Proactive metric monitoring that detects anomalies and sends plain-English summaries to Slack or email
- Ask Data (NLQ) — Natural language queries like "show me Q4 revenue by product line" return interactive charts
Tableau Features 🌟
| Feature | Description |
|---|---|
| 📊 24+ Chart Types | Bar, line, scatter, heatmap, treemap, box plot, Gantt, spatial maps, and more |
| 🧠 Einstein Copilot | AI-assisted calculated fields, LOD expressions, and chart recommendations |
| 📈 Tableau Pulse | Proactive metric monitoring with anomaly detection and Slack alerts |
| 🤖 Tableau Agent | Autonomous multi-step data analysis (new in 2025) |
| 🔄 Tableau Prep | Visual data preparation and cleaning pipeline |
| 🌐 Tableau Public | Free tier for publishing interactive visualizations |
| 🔒 Enterprise Governance | Row-level security, data policies, audit logging, SOC 2 compliance |
| 📱 Mobile Analytics | Native iOS/Android apps with offline capability |
Tableau Pricing 💸
| Tier | Price | What You Get |
|---|---|---|
| 🔵 Viewer | $15/user/month | View, interact, and filter published dashboards |
| 🟣 Explorer | $42/user/month | Create visualizations from existing data sources |
| 🟡 Creator | $75/user/month | Full authoring, Tableau Prep, Tableau Desktop |
| 🏢 Tableau+ | Custom | Einstein Copilot, Tableau Pulse, Tableau Agent, premium AI features |
The catch: A team of 10 creators costs $750/month — before data infrastructure. Tableau's learning curve is steep (expect 2-4 weeks of onboarding), and Einstein AI features require the premium Tableau+ tier, adding to already high per-seat costs. For teams that don't need petabyte-scale analysis, the investment may not justify the capability.
Best for: Enterprise organizations with dedicated analytics teams, complex multi-source data environments, and budget for $42-75/user/month licensing.
See how Tableau compares to Taskade →
#3 Microsoft Power BI
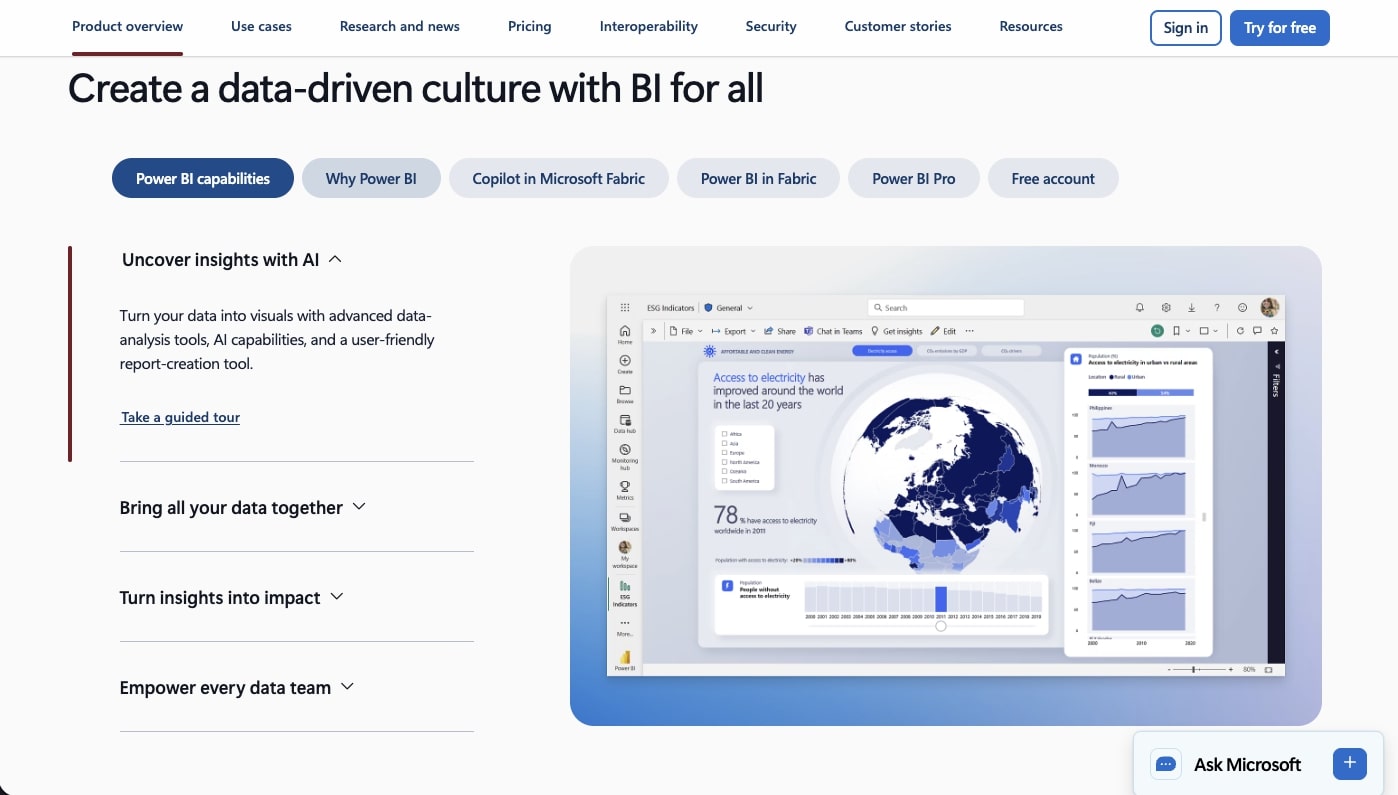
Microsoft Power BI is the most widely deployed enterprise BI tool worldwide, with over 36 million monthly users across organizations of every size. In 2025, Microsoft raised Pro pricing from $10 to $14/user/month and rebranded Premium Per User to "Fabric" pricing at $24/user/month — reflecting the platform's deep integration with Microsoft Fabric, Azure Synapse, and the broader Microsoft 365 ecosystem.
Power BI's core strength is its seamless connection to Excel, SharePoint, Teams, and Azure. If your organization already pays for Microsoft 365, Power BI Pro may be included or discounted in your Enterprise Agreement. The DAX formula language and Power Query M provide powerful data modeling, though both carry significant learning curves.
Copilot AI in Power BI
Microsoft's Copilot for Power BI (generally available since late 2024) brings generative AI to report creation:
- Report Generation — Describe a report in natural language and Copilot creates pages with appropriate visualizations, filters, and slicers
- Narrative Summaries — Copilot writes plain-English explanations of what your data shows, updating automatically as filters change
- DAX Query Assist — Generate DAX formulas from natural language descriptions (reduces the steepest part of Power BI's learning curve)
- Q&A Visual — Ask questions like "total sales last quarter by region" and get instant chart answers
Power BI Features 🌟
| Feature | Description |
|---|---|
| 🤖 Copilot AI | Generative AI for report creation, DAX formulas, and narrative summaries |
| 📊 30+ Visualizations | Built-in charts plus a marketplace with 300+ custom visuals |
| 🔗 Microsoft Integration | Native connections to Excel, SharePoint, Teams, Dynamics 365, Azure |
| 📐 DAX + Power Query | Advanced data modeling and transformation language |
| 📱 Mobile Apps | Native iOS, Android, and Windows apps with offline support |
| 🌊 Real-Time Streaming | Live dashboards with streaming datasets from IoT and event sources |
| 🔒 Enterprise Security | Row-level security, sensitivity labels, Microsoft Purview integration |
| 🏗️ Fabric Integration | Unified analytics platform with lakehouse, data warehouse, and ML |
Power BI Pricing 💸
| Tier | Price | What You Get |
|---|---|---|
| 🟢 Free (Desktop) | $0 | Full authoring in Power BI Desktop, no sharing |
| 🔵 Pro | $14/user/month | Publishing, sharing, collaboration, 1 GB model size |
| 🟣 Premium Per User (PPU) | $24/user/month | Larger datasets (100 GB), paginated reports, deployment pipelines |
| 🏢 Fabric Capacity | From $262/month | Dedicated compute, unlimited viewers, AI/ML workloads |
The catch: Power BI Desktop is free but useless without Pro licenses for sharing — so the "free" tier is effectively a trial. DAX and Power Query M have steep learning curves rivaling SQL. Copilot AI requires a separate Microsoft 365 Copilot license ($30/user/month) on top of Power BI licensing. And Power BI outside the Microsoft ecosystem (connecting to Salesforce, Google Sheets, or non-Azure databases) is clunky compared to dedicated connectors in Tableau or Taskade's 100+ integrations.
Best for: Organizations already invested in Microsoft 365/Azure that want BI tightly integrated with their existing stack.
See how Power BI compares to Taskade →
#4 Metabase
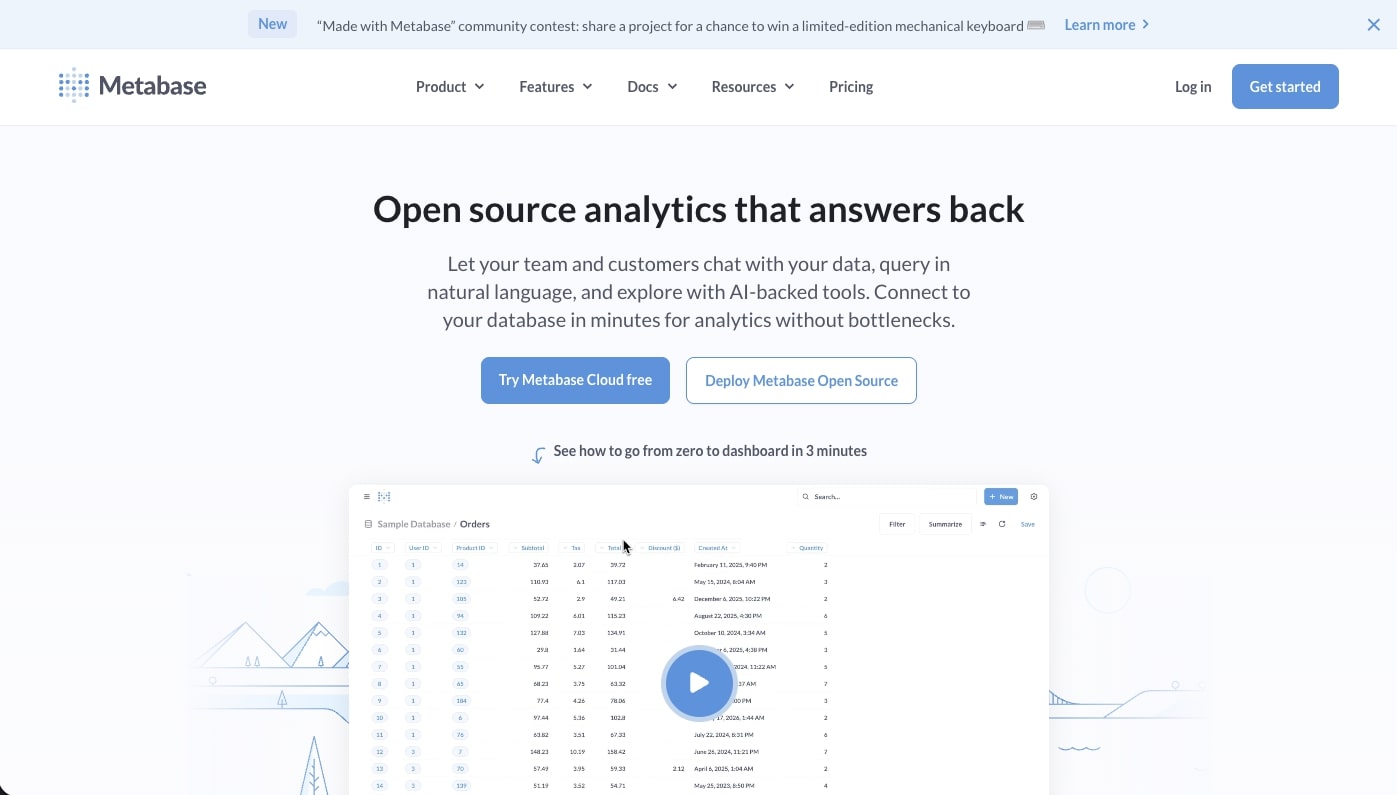
Metabase is the most popular open-source BI tool, with over 60,000 organizations and 200,000+ active installations running on self-hosted infrastructure or Metabase Cloud. The platform strikes a rare balance: a visual query builder simple enough for product managers, combined with a native SQL editor powerful enough for data engineers — all without per-user licensing fees on the open-source tier.
The visual query builder (called the "Notebook editor") lets non-technical users build multi-step queries through a point-and-click interface that translates to SQL behind the scenes. Power users can switch to raw SQL at any point, and results from either mode feed into the same dashboard framework.
Metabase AI and Automation
Metabase's AI story is more restrained than enterprise BI tools, focusing on practical intelligence over marketing sizzle:
- Question Suggestions — Metabase analyzes your database schema and suggests relevant questions you haven't asked yet
- X-ray Mode — Automatic exploratory analysis that surfaces trends, distributions, and anomalies in any table
- Alerts — Set threshold-based alerts on any question (e.g., "notify me when daily signups drop below 50")
- Subscriptions — Schedule dashboard snapshots delivered via email or Slack on custom cadences
Metabase Features 🌟
| Feature | Description |
|---|---|
| 📝 Notebook Editor | Visual query builder — no SQL required, translates to SQL behind the scenes |
| 💻 Native SQL | Full SQL editor with variables, snippets, and auto-complete |
| 📊 15+ Chart Types | Line, bar, scatter, funnel, map, pivot table, and more |
| 🔗 Embedded Analytics | Full-page or iframe embeds with signed tokens for customer-facing dashboards |
| 🔒 Data Sandboxes | Row-level and column-level permissions based on user attributes |
| 📱 Responsive Design | Dashboards auto-adapt to mobile screens (no native app) |
| 🐳 Docker Deploy | One-command self-hosted deployment via Docker |
| 🔄 Database Support | PostgreSQL, MySQL, MongoDB, BigQuery, Snowflake, Redshift, 20+ databases |
Metabase Pricing 💸
| Tier | Price | What You Get |
|---|---|---|
| 🟢 Open Source | Free forever | Self-hosted, unlimited users, core features, community support |
| 🔵 Starter (Cloud) | $85/month (5 users) | Metabase Cloud hosting, email support, automatic updates |
| 🟣 Pro (Self-Hosted) | $500/month (50 users) | SSO/SAML, data sandboxes, serialization, audit logs |
| 🟡 Pro (Cloud) | $500/month (50 users) | Same as self-hosted Pro + managed hosting |
| 🏢 Enterprise | Custom | Priority support, SLA, advanced caching, custom drivers |
The catch: Metabase's open-source tier is genuinely powerful, but it requires your team to manage hosting, upgrades, and database backups. There's no built-in AI copilot for generating dashboards from natural language — you still need to understand your data schema to build questions. And while the visual query builder handles 80% of use cases, complex analytical queries (window functions, CTEs, recursive queries) require raw SQL. For teams that want AI to handle the heavy lifting, Taskade Genesis generates complete dashboards from a single prompt.
Best for: Technical teams and startups wanting powerful, self-hosted BI without per-user licensing costs.
See how Metabase compares to Taskade →
#5 Looker (Google Cloud)
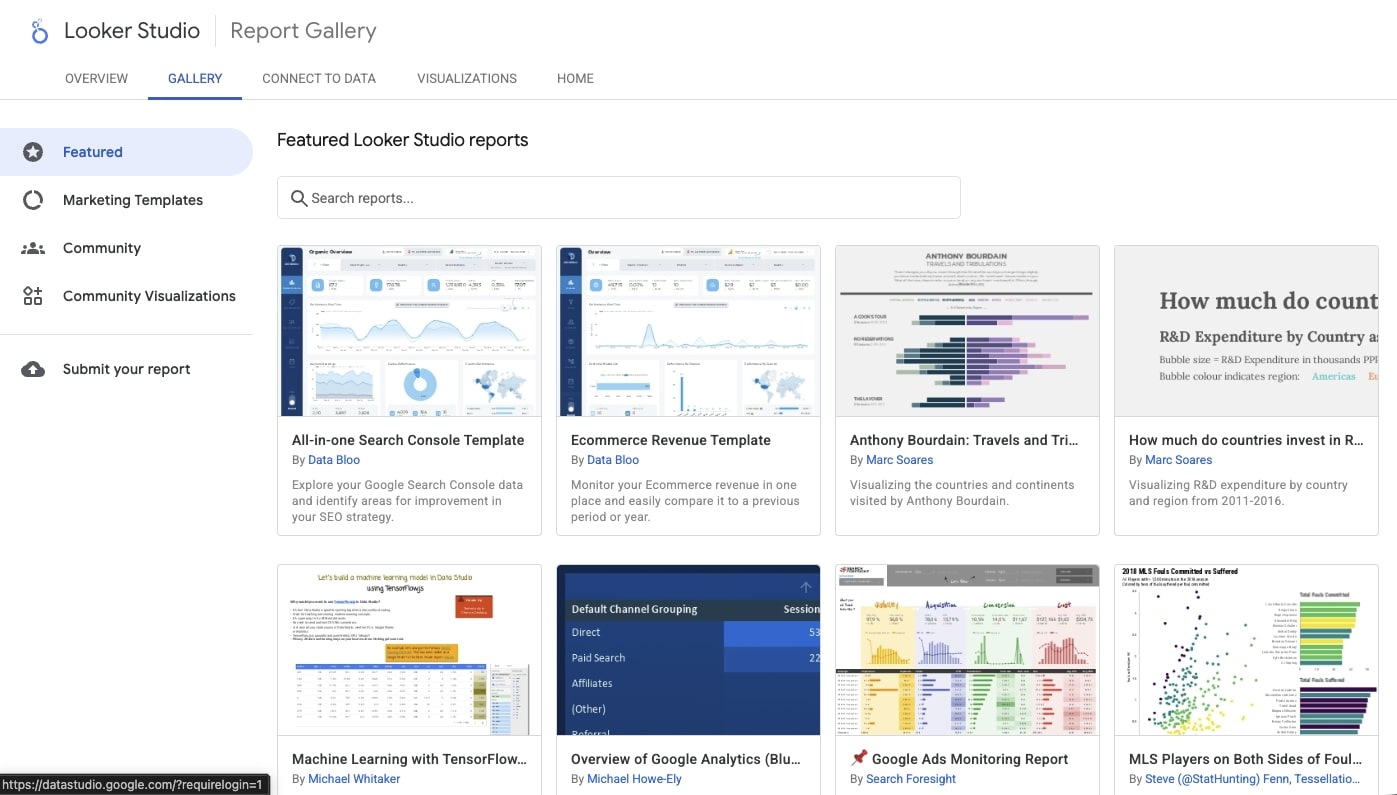
Looker is Google Cloud's enterprise BI platform, built around a unique semantic modeling layer called LookML that defines business metrics once and reuses them across every dashboard, report, and embedded analytics application. In 2025-2026, Google unified Looker and Looker Studio under a single "Looker" brand, adding Gemini AI for conversational analytics, formula generation, and automated data exploration.
The platform's architecture is fundamentally different from drag-and-drop tools: LookML models live in Git repositories, enabling version control, code review, and CI/CD for your analytics layer. This makes Looker the most engineering-friendly enterprise BI tool — but also the most complex to set up.
Gemini AI in Looker
Google's Gemini integration (rolled out through 2025) adds AI capabilities across the Looker platform:
- Conversational Analytics — Ask questions in natural language; Gemini translates to LookML-aware queries that respect your semantic model
- Formula Generation — Describe calculations in plain English and Gemini generates table calculations and custom measures
- Explore Assistant — Guided data exploration where Gemini suggests relevant dimensions, measures, and filters based on your question
- Looker Studio AI — Auto-generates reports from data source descriptions (available in the free Looker Studio tier)
Looker Features 🌟
| Feature | Description |
|---|---|
| 📐 LookML | Git-versioned semantic modeling language — define metrics once, reuse everywhere |
| 🤖 Gemini AI | Conversational analytics, formula generation, and exploration assist |
| 🔗 BigQuery Native | Direct integration with Google BigQuery for petabyte-scale queries |
| 🌐 Embedded Analytics | White-labeled dashboards for customer-facing products via Looker Embed SDK |
| 🔒 Enterprise Governance | Row-level security, content access controls, usage analytics, audit logs |
| 📱 Looker Studio (Free) | Drag-and-drop reporting tool for non-technical users (formerly Google Data Studio) |
| 🔄 Git Integration | Version control for LookML models with branching, pull requests, and CI/CD |
| 📊 Unlimited Viewers | No per-viewer licensing — only model developers need paid seats |
Looker Pricing 💸
| Tier | Price | What You Get |
|---|---|---|
| 🟢 Looker Studio | Free | Drag-and-drop reports, Google data source connectors, Gemini AI (basic) |
| 🔵 Looker Studio Pro | $9/user/month | Team collaboration, team content management, Google admin controls |
| 🟣 Looker (Enterprise) | Contact sales | Full LookML, embedded analytics, BigQuery modeling, Gemini advanced |
| 🏢 Looker+ (Premium) | Contact sales | Dedicated capacity, premium SLA, advanced Gemini features |
The catch: Looker's enterprise tier requires a Google Cloud commitment and annual contracts — typically $30,000-$100,000+/year depending on data volume and users. LookML requires developers to set up and maintain, creating a dependency on technical staff. And while Looker Studio is free, it lacks the semantic layer, embedded analytics, and governance that make enterprise Looker valuable. Organizations outside the Google Cloud ecosystem face additional data pipeline complexity compared to tools with broader native connectors.
Best for: Google Cloud-native organizations wanting engineering-grade BI with version-controlled semantic models and unlimited viewer scaling.
See how Looker compares to Taskade →
#6 ThoughtSpot
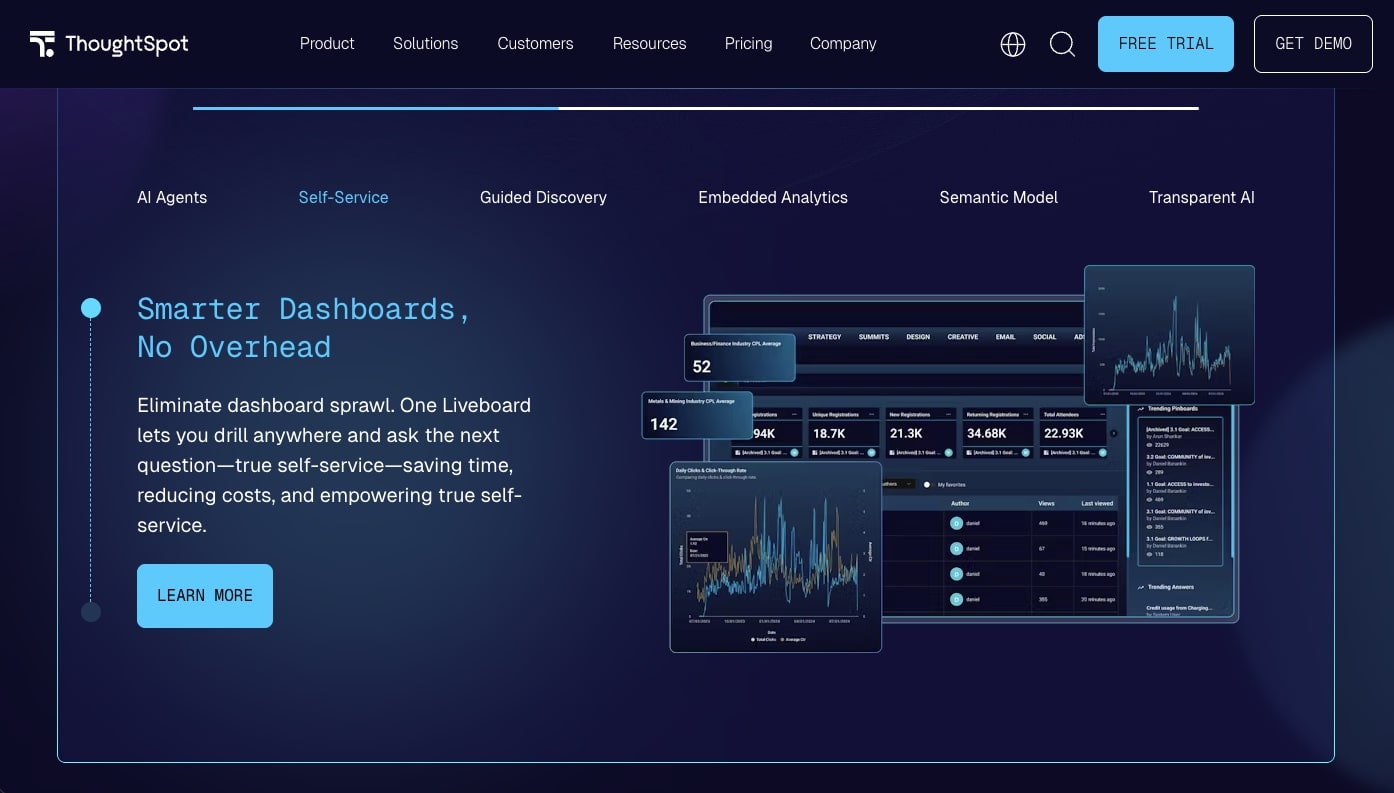
ThoughtSpot pioneered search-driven analytics and remains the leader in natural language BI, processing over 1 billion queries annually across its customer base. The platform's core premise is simple: type a question like you'd type a Google search, and ThoughtSpot returns an interactive visualization. In 2025-2026, ThoughtSpot added Spotter — an AI-powered analyst that goes beyond search to proactively surface insights, explain trends, and recommend next questions.
Unlike traditional BI tools that require dashboard design skills, ThoughtSpot is built for the 99% of employees who never learned SQL or Tableau. The trade-off is that it requires a connected data warehouse (Snowflake, BigQuery, Databricks, Redshift) — ThoughtSpot doesn't store data itself.
ThoughtSpot AI Features
ThoughtSpot has invested heavily in AI, making it arguably the most NLQ-focused platform in the market:
- Spotter (AI Analyst) — A conversational AI agent that understands follow-up questions, remembers context across a session, and proactively suggests related analyses
- SpotIQ — Automated anomaly detection that scans millions of data combinations and surfaces statistically significant changes
- Search Answers — Type natural language queries and get instant charts with automatic chart type selection
- AI-Generated Formulas — Describe a calculation in plain English and ThoughtSpot generates the correct analytical formula
- Monitor — Scheduled alerts when metrics cross user-defined thresholds, delivered via email or Slack
ThoughtSpot Features 🌟
| Feature | Description |
|---|---|
| 🔍 Search Analytics | Google-like search bar for data queries — type questions, get charts |
| 🤖 Spotter AI | Conversational AI analyst with memory, follow-ups, and proactive insights |
| 📈 SpotIQ | Automated anomaly detection across millions of data point combinations |
| 🔗 Live Query | Direct queries against Snowflake, BigQuery, Databricks — no data duplication |
| 🌐 Embedded Analytics | White-labeled analytics for SaaS products via JavaScript SDK |
| 📱 Mobile App | Native mobile experience with full search and visualization |
| 🔒 Row-Level Security | Fine-grained access controls inheriting warehouse permissions |
| 📊 Liveboards | Real-time collaborative dashboards with cross-filtering |
ThoughtSpot Pricing 💸
| Tier | Price | What You Get |
|---|---|---|
| 🔵 Essentials | $25/user/month | Search analytics, basic SpotIQ, 5 data connections |
| 🟣 Pro | Contact sales | Spotter AI, unlimited connections, embedded analytics, Monitor |
| 🟡 Enterprise | Custom | Advanced governance, custom branding, premium SLA, dedicated CSM |
The catch: ThoughtSpot requires a cloud data warehouse (Snowflake, BigQuery, etc.) as a prerequisite — it's a visualization layer, not a data store. This means your total analytics cost is ThoughtSpot licensing plus warehouse costs ($2,000-10,000+/month for mid-size companies). The $25/user/month entry tier is limited to 5 data connections, and the AI-powered Spotter feature requires the Pro tier. For teams without an existing data warehouse, Taskade Genesis provides a simpler path — your workspace is the data source, eliminating the warehouse dependency entirely.
Best for: Data-forward organizations with existing cloud data warehouses that want to democratize analytics through natural language search.
See how ThoughtSpot compares to Taskade →
#7 Klipfolio
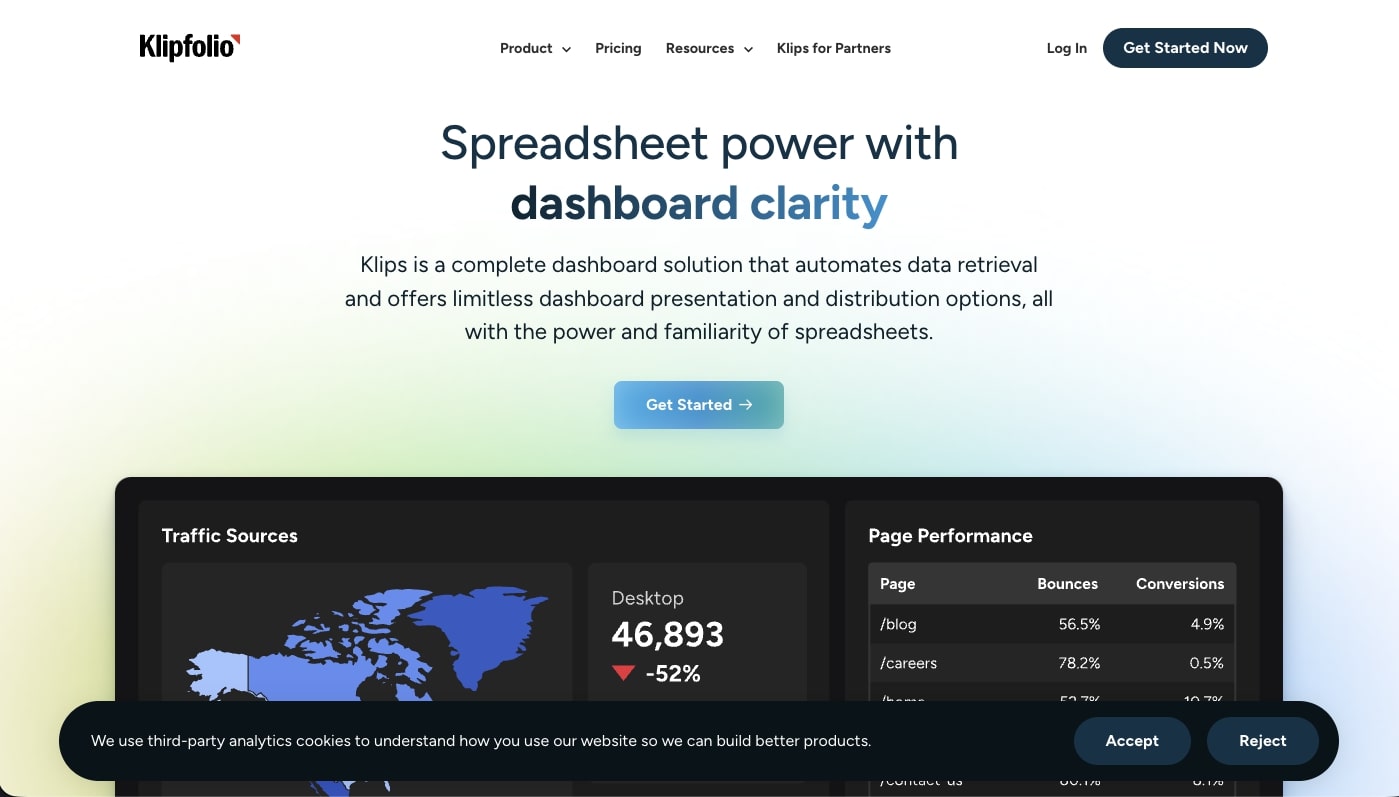
Klipfolio occupies a focused niche in the dashboard market: real-time KPI tracking dashboards designed for wall-mounted TVs and team displays. The platform now operates as two products — Klips (the original real-time dashboard builder) and PowerMetrics (a newer metrics catalog and self-serve analytics layer). With 100+ pre-built data connectors to popular SaaS tools, Klipfolio is purpose-built for marketing, sales, and operations teams that want live metrics without touching SQL.
The platform's strength is its connector library and real-time refresh rates — dashboards update every few minutes by default, with some connectors supporting near-real-time streaming. This makes Klipfolio ideal for operations centers, sales floors, and support teams that need always-on visibility.
What Sets Klipfolio Apart
- PowerMetrics — A metrics catalog that lets teams define, track, and share KPIs with standardized definitions and automatic goal tracking
- TV Display Mode — Optimized rendering for large screens with auto-rotation between dashboard pages and high-contrast themes
- White-Labeling — Agencies can rebrand dashboards for client reporting with custom logos, colors, and domains
- Pre-Built Templates — 400+ dashboard templates organized by tool (Google Analytics, HubSpot, Stripe, Shopify) and department
- Custom Formulas — Combine data from multiple sources with calculated metrics and conditional formatting
Klipfolio Features 🌟
| Feature | Description |
|---|---|
| 📺 TV Dashboard Mode | Auto-rotating, high-contrast displays optimized for wall-mounted screens |
| 🔗 100+ Connectors | Pre-built integrations with Google Analytics, HubSpot, Stripe, Shopify, and more |
| 📊 PowerMetrics | Centralized metrics catalog with standardized KPI definitions and goal tracking |
| 🏷️ White-Labeling | Custom branding for agency client reporting |
| 📐 Custom Formulas | Combine cross-source data with calculated metrics |
| 📱 Mobile Dashboards | Responsive dashboards accessible on any device |
| 🔄 Real-Time Refresh | Automatic data updates every few minutes |
| 📋 400+ Templates | Pre-built dashboards organized by tool and department |
Klipfolio Pricing 💸
| Tier | Price | What You Get |
|---|---|---|
| 🔵 Grow | $49/month | 4 users, 20 Klips, 40 data sources |
| 🟣 Team | $99/month | 10 users, unlimited Klips, 60 data sources |
| 🟡 Team+ | $199/month | Unlimited users, white-labeling, priority support |
| 📊 PowerMetrics | $0-199/month | Separate product for metrics catalog and self-serve analytics |
The catch: Klipfolio is a dashboard display tool, not an analytics platform. It connects to data sources and shows metrics — but it can't run complex queries, perform statistical analysis, or let you drill into underlying data the way Tableau or Metabase can. The dual-product strategy (Klips vs PowerMetrics) creates confusion, and the pricing stacks up quickly for agencies managing multiple client accounts. For teams that need AI-powered analysis alongside their dashboards, Taskade Genesis combines live metrics with embedded AI agents that can explain trends and trigger automated actions.
Best for: Marketing agencies and operations teams wanting always-on KPI displays on TV screens.
See how Klipfolio compares to Taskade →
#8 Domo
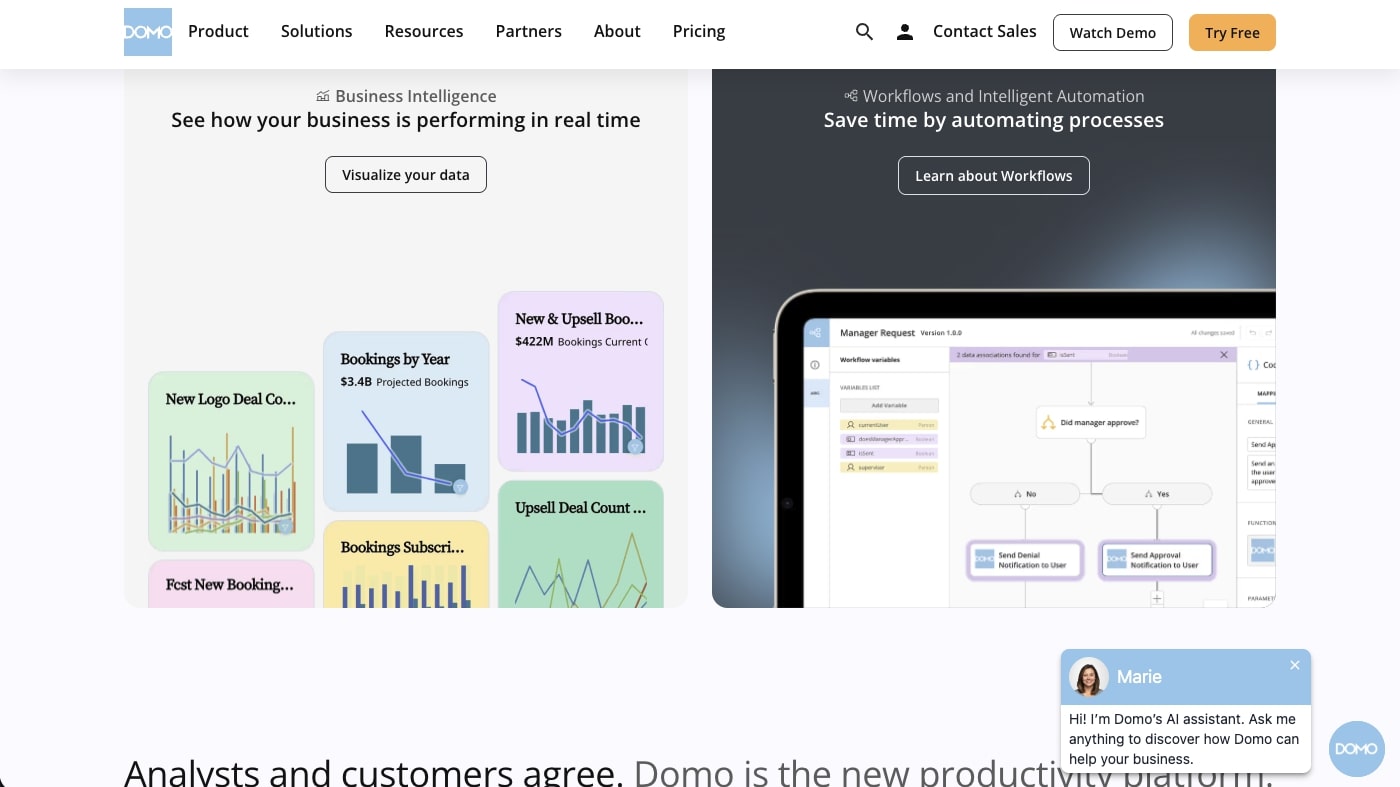
Domo is a cloud-native data platform that combines data integration, transformation, visualization, and collaboration in a single system — positioning itself as an all-in-one alternative to assembling separate ETL, warehouse, and BI tools. With over 1,000 pre-built data connectors, Domo handles the full pipeline from raw data to executive dashboard, making it attractive for mid-market and enterprise companies drowning in SaaS data sprawl.
In 2024, Domo shifted from per-user licensing to a consumption-based (credit) model, and typical annual contracts now range from $50,000-$150,000 for mid-market deployments. This makes Domo one of the most expensive platforms in this list — but also one of the most complete for organizations that need a unified data platform rather than a standalone dashboard tool.
Domo AI Features
Domo's AI capabilities focus on data integration and natural language querying:
- Natural Language Analytics — Conversational interface for finding KPIs and running queries without SQL
- AI Data Prep — Automated data cleaning, transformation, and anomaly detection in the ETL pipeline
- Buzz Collaboration — Built-in team messaging with contextual data sharing (Slack-like, but tied to dashboards)
- App Framework — Build custom data applications with drag-and-drop components and embedded analytics
- Alert Studio — Rule-based and AI-powered alerting with customizable thresholds and routing
Domo Features 🌟
| Feature | Description |
|---|---|
| 🔗 1,000+ Connectors | Pre-built integrations covering marketing, sales, finance, HR, and operations |
| 🤖 NL Analytics | Conversational querying without SQL for business users |
| 💬 Buzz | Built-in messaging and collaboration tied to data and dashboards |
| 🔄 Magic ETL | Visual data pipeline builder with AI-assisted transformations |
| 📱 Mobile-First | Native mobile apps designed for executive consumption |
| 🛠️ App Framework | Build custom data applications with embedded analytics |
| 🔒 Governance | Role-based access, PDP (Personalized Data Permissions), audit trails |
| 🌐 Embedded Analytics | White-labeled dashboards for customer-facing use cases |
Domo Pricing 💸
| Tier | Price | What You Get |
|---|---|---|
| 🟢 Free | $0 | Limited features, exploration tier |
| 🔵 Consumption-Based | Custom (credit model) | Unlimited users, costs scale with data volume and query frequency |
| 🏢 Enterprise | $50K-150K+/year typical | Full platform, priority support, SLA, advanced governance |
The catch: Domo's consumption-based pricing is intentionally opaque — credits translate to dollars at rates that require a sales conversation to understand. Multiple reviews cite annual contracts of $50,000-$150,000+ for mid-market companies, with enterprise deals exceeding $500,000/year. The platform's AI features, while functional, require significant data modeling and data science expertise to produce useful output. And while 1,000+ connectors sounds impressive, many are community-maintained with inconsistent quality. For teams that want transparent pricing and AI that works out of the box, Taskade Genesis delivers dashboards from prompts at a flat $10/month for 10 users.
Best for: Mid-market and enterprise organizations needing a unified data platform (ETL + warehouse + BI) with strong connector coverage.
See how Domo compares to Taskade →
#9 Databox
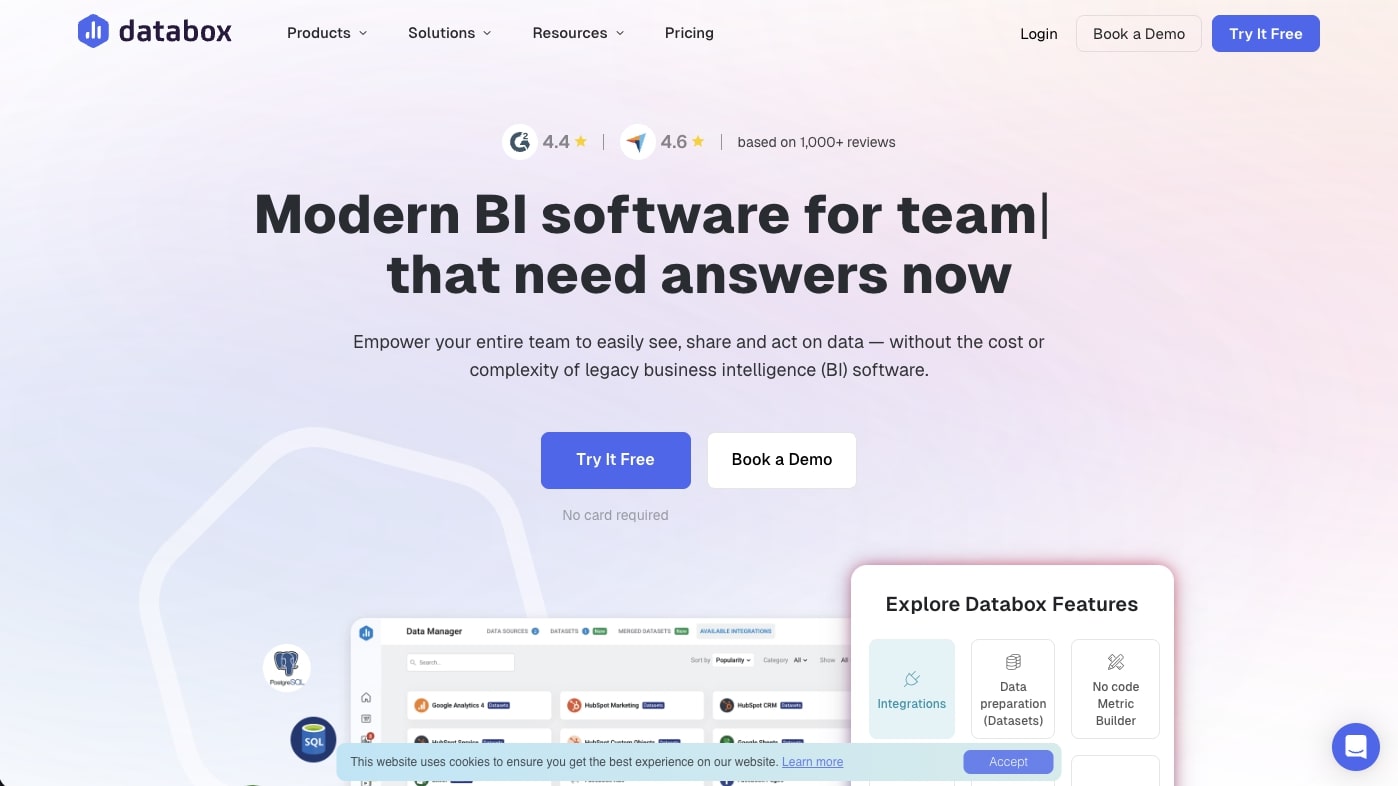
Databox is a metrics dashboard platform purpose-built for marketing, sales, and SaaS teams that need to unify data from dozens of business tools into single-pane-of-glass reporting. With 100+ native integrations to tools like HubSpot, Google Analytics, Stripe, Facebook Ads, and Shopify, Databox excels at pulling scattered SaaS metrics into clean, shareable dashboards — without requiring SQL or data warehouse setup.
Important pricing change: Databox eliminated its free plan in July 2025. The platform now starts at $159/month (annual billing), making it significantly more expensive than it was for small teams. The tradeoff is that all paid plans include unlimited users and unlimited dashboards.
Databox AI Features
Databox has been investing in AI analytics through its "Genie" initiative:
- Genie AI Analyst — An AI-powered data analyst that answers questions about your metrics in natural language (launching in 2026)
- AI Performance Summaries — Automated written overviews explaining what your key metrics are doing and why (Growth+ plans)
- Metric Forecasts — Predictive analytics showing where your numbers are heading based on historical trends
- Anomaly Detection — Continuous monitoring that alerts you when metrics deviate from expected patterns
- Benchmark Groups — Compare your metrics against anonymized peer company data for context
Databox Features 🌟
| Feature | Description |
|---|---|
| 🔗 100+ Integrations | Native connectors to HubSpot, GA4, Stripe, Facebook Ads, Shopify, and more |
| 🤖 Genie AI | AI analyst for natural language metric queries (launching 2026) |
| 📊 Databoards | Drag-and-drop dashboard builder with 200+ pre-built templates |
| 🎯 Goal Tracking | Set targets for any metric and track progress with visual scorecards |
| 📈 Forecasting | AI-powered metric predictions based on historical trends |
| 📺 Data Walls | TV display mode for always-on team metric visibility |
| 📱 Mobile App | Native iOS/Android app with push notification alerts |
| 🏷️ Benchmarks | Compare your metrics against anonymized industry peer data |
Databox Pricing 💸
| Tier | Price (Annual) | What You Get |
|---|---|---|
| 🔵 Professional | $159/month | 3 data sources, unlimited users, unlimited dashboards, custom metrics |
| 🟣 Growth | $399/month | More sources, AI summaries, forecasting, data warehouse support |
| 🟡 Premium | Custom | 100 data sources included, premium support, dedicated CSM |
Note: Monthly billing is ~20% higher. 14-day free trial available on Growth plan.
The catch: The elimination of Databox's free plan means the entry price jumped from $0 to $159/month — a significant barrier for startups and small teams. AI Performance Summaries are restricted to Growth+ plans ($399/month), and the AI analyst feature has daily quota limits (800 queries/account, 100/user). Perhaps most importantly, Databox is a dashboard display tool, not an analytics platform — it pulls data from other tools and shows it, but can't run complex queries or transform data. For teams wanting AI-powered dashboards without the premium price tag, Taskade Genesis provides unlimited dashboard apps starting from a free tier, with embedded AI agents that analyze and explain your data.
Best for: Marketing and SaaS teams wanting unified metric dashboards from 100+ business tools, with budget for $159+/month.
See how Databox compares to Taskade →
#10 Geckoboard
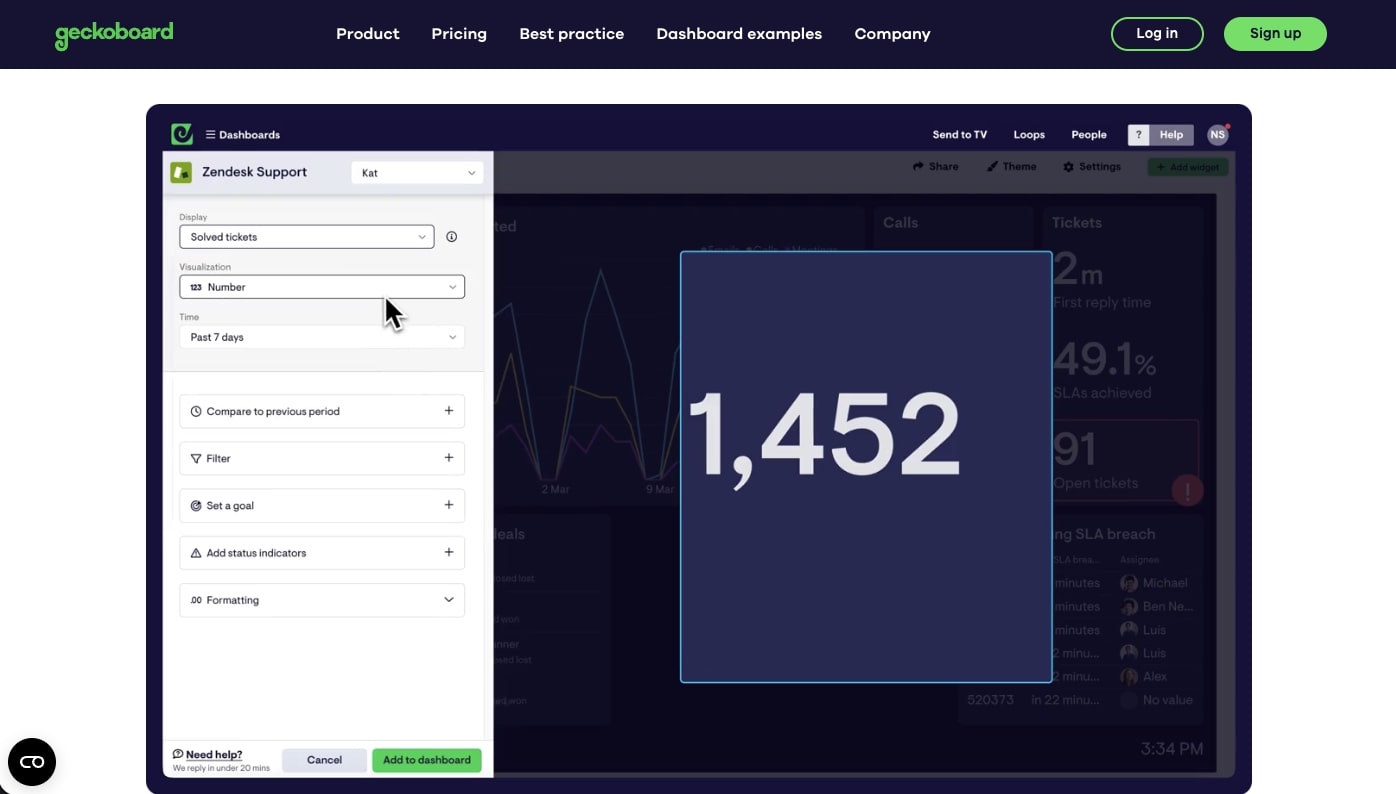
Geckoboard is the most focused tool in this list — it does exactly one thing well: real-time TV dashboards for team visibility. With 90+ data source integrations and a design philosophy built around large-screen readability, Geckoboard is purpose-built for support teams, sales floors, and operations centers that need always-on metric displays. No SQL, no complex queries, no analytics — just clean numbers on a screen.
The platform's simplicity is both its strength and limitation. Setup takes minutes rather than hours, and dashboards are designed for glanceability with large numbers, status indicators, and color-coded thresholds. But if you need to ask "why" a number changed, you'll need a different tool.
Geckoboard Features 🌟
| Feature | Description |
|---|---|
| 📺 TV Display Mode | Full-screen, auto-rotating dashboards optimized for wall-mounted displays |
| 🔗 90+ Integrations | Pre-built connectors to Zendesk, Salesforce, Jira, Google Sheets, and more |
| 📊 Widget Library | Numbers, line charts, bar charts, gauges, leaderboards, status indicators |
| 🎨 Clean Design | Minimalist layouts with high-contrast themes for screen readability |
| 🔄 Real-Time Updates | Automatic data refresh every few minutes |
| 🔗 Share Links | Send live dashboard links to stakeholders without accounts |
| 📱 Responsive | Dashboards adapt to browser and mobile screens |
| 🖥️ Multiple Screens | Route different dashboards to different TVs across offices |
Geckoboard Pricing 💸
| Tier | Price | What You Get |
|---|---|---|
| 🔵 Essential | $60/month | 1 dashboard, 1 editor, 10 viewers, 1 TV connection |
| 🟣 Core | $175/month | 20 dashboards, 25+ viewers, 3+ TV connections |
| 🟡 Pro | $319/month | 50 dashboards, 3+ editors, 50+ viewers, 5+ TVs |
| 🏢 Enterprise | Custom | Unlimited dashboards, SSO, dedicated support |
20% discount for non-profits.
The catch: Geckoboard has no AI features — no natural language queries, no automated insights, no anomaly detection. At $60/month for a single dashboard with 1 editor, it's the most expensive per-dashboard option in this list. You can't blend data from different sources (metrics sit side by side but don't interact), customization is limited (locked font sizes, basic chart options), and there's no analytical depth beyond displaying numbers. For teams that want TV-quality dashboards plus AI analysis and automations, Taskade Genesis generates shareable dashboards with embedded AI agents that explain what the numbers mean — starting from a free tier.
Best for: Support, sales, and operations teams that need simple, always-on TV dashboards with minimal setup.
See how Geckoboard compares to Taskade →
🤔 How to Choose the Right AI Dashboard Builder
Choosing the right dashboard tool depends on four factors: where your data lives, who will build dashboards, how much AI you need, and what you can afford. Here's a decision framework based on our testing.
By Use Case
| If you need... | Best choice | Why |
|---|---|---|
| Living dashboards with AI agents | Taskade Genesis | Only platform with embedded agents + automations + workspace-native data |
| Enterprise BI with advanced statistics | Tableau or Power BI | Deepest visualization libraries, certified analyst ecosystems |
| Open-source, self-hosted BI | Metabase | Free forever tier, Docker deployment, no per-user licensing |
| Natural language data exploration | ThoughtSpot | Most advanced NLQ with Spotter AI agent and SpotIQ anomaly detection |
| Real-time TV displays | Geckoboard or Klipfolio | Purpose-built for wall-mounted, glanceable metric screens |
| Unified SaaS metrics | Databox | 100+ native integrations to marketing and sales tools |
| Google Cloud-native BI | Looker | LookML semantic layer, BigQuery integration, Gemini AI |
| All-in-one data platform | Domo | ETL + warehouse + BI in one (if you have the budget) |
By Budget (Team of 10)
| Tool | Annual Cost (10 Users) | What You Get |
|---|---|---|
| Metabase OSS | $0 | Self-hosted, unlimited users (you manage infrastructure) |
| Taskade Genesis Free | $0 | 3 apps, core AI, up to 3,000 AI credits |
| Taskade Genesis Pro | $120/year ($10/mo annual) | Unlimited agents and automations, live hosting, background agents, 10 users |
| Power BI Pro | $1,680/year | Microsoft ecosystem BI, Copilot AI (requires separate license) |
| ThoughtSpot Essentials | $3,000/year | Search analytics for 10 users, 25M row limit |
| Tableau Creator | $9,000/year | Full authoring for 10 creators |
| Databox Professional | $1,908/year | 3 data sources, unlimited users |
| Geckoboard Core | $2,100/year | 20 dashboards, 25 viewers |
| Domo | $50,000+/year | Full platform, consumption-based |
| Looker Enterprise | $66,600+/year | LookML, embedded analytics, Gemini AI |
Decision Questions
Before choosing, answer these five questions:
Where does your data live? If it's in a data warehouse (Snowflake, BigQuery), consider ThoughtSpot or Looker. If it's in SaaS tools (HubSpot, Stripe), consider Databox or Taskade. If it's in spreadsheets and project management tools, Taskade Genesis is the simplest path.
Who will build dashboards? If you have dedicated analysts, Tableau and Power BI offer the deepest capabilities. If business users need self-serve, ThoughtSpot and Taskade Genesis require zero technical skills.
Do you need AI to explain trends or just display them? Geckoboard and Klipfolio display metrics. ThoughtSpot and Taskade Genesis explain them with AI. Tableau and Power BI are adding AI but it's still supplementary.
Is this for deep analysis or operational monitoring? Deep analysis → Tableau, Power BI, or Looker. Operational monitoring → Geckoboard, Klipfolio, or Taskade Genesis. Mixed use → ThoughtSpot or Metabase.
What's your total budget? Under $500/year → Metabase OSS or Taskade Genesis Free/Pro. $1,000-5,000/year → Power BI, ThoughtSpot, or Databox. $10,000+/year → Tableau, Domo, or Looker.
🚀 The Bottom Line
The BI market is splitting into two worlds. Traditional BI (Tableau, Power BI, Looker) requires dedicated analysts, complex data pipelines, and five-figure annual budgets — but delivers the deepest analytical capabilities for enterprise data teams. AI-native dashboards (Taskade Genesis, ThoughtSpot) let anyone describe what they want to see and get working visualizations in minutes — trading analytical depth for speed and accessibility.
Here's our recommendation matrix:
| Scenario | Our Pick | Runner-Up |
|---|---|---|
| 🏆 Best overall for teams | Taskade Genesis — living dashboards with AI agents | ThoughtSpot — best NLQ |
| 🏢 Best for enterprise analytics | Tableau — deepest viz library | Power BI — best Microsoft value |
| 💰 Best free option | Metabase OSS — no per-user limits | Taskade Genesis Free — AI included |
| 📺 Best for TV displays | Geckoboard — cleanest display design | Klipfolio — more connectors |
| 📊 Best for marketing teams | Databox — 100+ SaaS connectors | Klipfolio PowerMetrics |
| 🔍 Best for natural language | ThoughtSpot — Spotter AI agent | Power BI Copilot |
| ☁️ Best for Google Cloud | Looker — LookML + BigQuery native | Looker Studio (free) |
The most important shift in 2026? Dashboards are becoming intelligent systems, not static displays. The next generation of dashboard builders doesn't just show data — it explains trends, detects anomalies, and triggers automated actions. Taskade Genesis represents this future: dashboards powered by Workspace DNA where your projects feed intelligence, your agents analyze patterns, and your automations execute responses.
Whether you're tracking revenue, monitoring support queues, or measuring campaign performance — the right AI dashboard builder eliminates the weeks of setup between having data and understanding it.
Ready to create your first AI dashboard?
👉 Build a dashboard with Taskade Genesis →
👉 Clone a dashboard template →
👉 Explore AI agents for analytics →
👉 See 100+ automation integrations →
💬 Frequently Asked Questions About AI Dashboard Builders
What is an AI dashboard builder?
An AI dashboard builder uses artificial intelligence to create data visualizations and analytics dashboards from natural language descriptions. Instead of manually designing chart layouts, writing SQL queries, and configuring data connections, you describe the dashboard you need ("show me monthly revenue by product line with a 12-month trend") and the AI generates it. The most advanced platforms — like Taskade Genesis — go beyond static visualization to include embedded AI agents that answer questions about your data and automations that trigger actions when metrics cross thresholds.
Do I need technical skills to use an AI dashboard builder?
No. The best AI dashboard builders in 2026 accept plain English descriptions and handle the technical complexity behind the scenes. Taskade Genesis uses vibe coding — describe your dashboard needs in a single prompt and get working visualizations in 2-15 minutes. No SQL, no data modeling, no programming skills required. Traditional BI tools like Tableau still require 2-4 weeks of onboarding and DAX/SQL proficiency for advanced use cases.
Can AI dashboards connect to my existing data?
Yes, though connection methods vary significantly by platform. Traditional BI tools (Tableau, Power BI, Looker) connect directly to databases and data warehouses via SQL. ThoughtSpot requires a cloud data warehouse (Snowflake, BigQuery) as a prerequisite. Databox and Klipfolio use pre-built API connectors to SaaS tools. Taskade Genesis takes a different approach — your workspace projects become the data source, with 100+ integrations pulling data from Stripe, HubSpot, Google Sheets, Slack, and more through automated workflows.
How do AI dashboards differ from traditional BI tools?
Traditional BI tools are implementation-first: you configure data connections, design layouts, write SQL/DAX queries, and build charts manually. AI dashboard builders are outcome-first: you describe what you want to see ("show me sales trends by region this quarter") and AI handles the implementation. The key difference is accessibility — according to Mordor Intelligence, fewer than 30% of employees in BI-deployed organizations actually use traditional tools, because the learning curve excludes non-technical staff. AI dashboards aim to serve the other 70%.
Can AI help me understand my dashboard data?
Yes, and this is where AI dashboards diverge most from traditional BI. ThoughtSpot's Spotter AI agent and SpotIQ autonomously scan millions of data combinations to surface anomalies and explain why metrics changed. Tableau's Einstein Copilot generates narrative summaries of dashboard data. Taskade Genesis embeds custom AI agents directly inside dashboards — agents trained on your workspace data that can answer questions like "why did support tickets spike last Tuesday?" in natural language and suggest automated responses.
Are AI-generated dashboards secure?
Security varies dramatically by platform. Enterprise tools (Tableau, Power BI, Looker) offer row-level security, SOC 2 compliance, audit logging, data masking, and Microsoft Purview/Google DLP integration. Metabase provides data sandboxes with column-level permissions. Taskade Genesis keeps data within your workspace with 7-tier role-based access control (Owner, Maintainer, Editor, Commenter, Collaborator, Participant, Viewer), password-protected published dashboards, and custom domain deployment. Always verify that a platform's security certifications match your compliance requirements (SOC 2, HIPAA, GDPR).
How much do AI dashboard builders cost?
Prices range from completely free (Metabase open-source, Taskade Genesis free tier, Looker Studio) to six-figure annual contracts (Domo at $50K-500K/year, Looker Enterprise at $66K+/year). Here's a quick cost comparison for a team of 10:
- Free: Metabase OSS (self-hosted), Taskade Genesis Free, Looker Studio
- Under $150/year: Taskade Genesis Pro ($120/year, 10 users included)
- $1,500-3,000/year: Power BI Pro ($1,680), ThoughtSpot Essentials ($3,000)
- $5,000-10,000/year: Tableau Creator ($9,000), Databox Professional ($1,908)
- $50,000+/year: Domo, Looker Enterprise
Can I share AI dashboards with my team?
Yes. Sharing capabilities differ by platform: Tableau and Power BI require viewer licenses ($15-35/user/month). Metabase offers embedded analytics with signed tokens for customer-facing dashboards. Geckoboard provides share links that don't require accounts. Taskade Genesis includes real-time collaboration with built-in chat, video, and screen sharing — plus the ability to publish dashboards to custom domains with password protection and 7-tier RBAC for granular access control.
How real-time are AI dashboard updates?
Update frequency depends on the tool and data source architecture. Geckoboard and Klipfolio refresh every few minutes via API polling. Power BI supports streaming datasets from IoT and event sources for near-real-time updates. ThoughtSpot runs live queries against your data warehouse on each interaction. Taskade Genesis dashboards update automatically as workspace data changes — and automations can trigger Slack alerts, email notifications, or workflow actions the moment a metric crosses a defined threshold.
Can I customize the look of AI-generated dashboards?
Yes. Most AI dashboard builders allow post-generation customization. With Taskade Genesis, you refine dashboards through conversation ("make the charts use our brand colors," "add a quarterly comparison column") or through direct editing in the workspace. Traditional tools like Tableau offer drag-and-drop customization with extensive formatting options. Geckoboard and Databox provide template-based customization. The key advantage of AI builders is iterative refinement — describe changes in natural language rather than hunting through menus and settings panels.
📚 Related Resources
AI Builder Comparisons:
- 10 Best AI App Builders — Complete comparison of no-code and AI app platforms
- 10 Best AI Website Generators — Build full sites without code
- 10 Best AI Booking Systems — AI-powered scheduling solutions
- 10 Best AI CRM Software — Customer management and sales automation
- 12 Best AI Content Creation Tools — Writing, video, and design tools
- 10 Top AI Social Media Management Tools — Scheduling and analytics
Productivity & Workflow:
- Best AI Productivity Tools for Teams — Team collaboration platforms compared
- Best Time Blocking Apps — Optimize your daily schedule
- AI Mind Mapping Tools — Visual brainstorming with AI
- AI Brainstorming Tools — Creative ideation for teams
- What Are SOPs? — Build effective processes with AI
Learn About Building with AI:
- What is Vibe Coding? — Build apps by describing what you want
- The App Builder Revolution — From idea to software in 5 minutes
- 50+ AI Apps You Can Clone — Complete template gallery
- Workspace DNA: The Living System — How Memory + Intelligence + Execution powers Taskade
Start Building:
- AI Dashboard Builder → — Create dashboards from prompts
- AI Analytics Tools → — Business intelligence made simple
- Browse Dashboard Templates → — Clone and customize
- AI Agents → — Build custom AI agents for data analysis
- Automation Workflows → — Connect 100+ integrations