


The modern office is a cognitive limbo. We're producing a crazy amount of data and ingesting more information than the human brain can chew. But as the adage goes "a picture is worth a thousand words," and so is visual collaboration.
In this article, we'll show you how you can use visual devices like mind maps and kanban boards to make your remote team more creative and productive.
💡 Before you start... Want to learn more about effective remote collaboration? Check other similar articles on the blog when you're done reading.
What's Visual Collaboration Anyway? 🤔
In a 2014 study, a team of MIT neuroscientists discovered that the human brain is capable of processing and "figuring out" what our eyes see in mere 13 milliseconds.
To put that into perspective, an average reader can process around 200-250 words per minute. That translates to 3-6 unimpressive words per second.
The lesson for today?
We're all wired for image processing. And we're damn good at it.
“The fact that you can do that at these high speeds indicates to us that what vision does is find concepts. That’s what the brain is doing all day long — trying to understand what we’re looking at [...]”
Mary C. Potter, MIT Department of Brain and Cognitive Sciences(1)
People have used visuals to get work done for hundreds of years. One of the prime examples of our romance with utilitarian visuals are hierarchical tree structures.
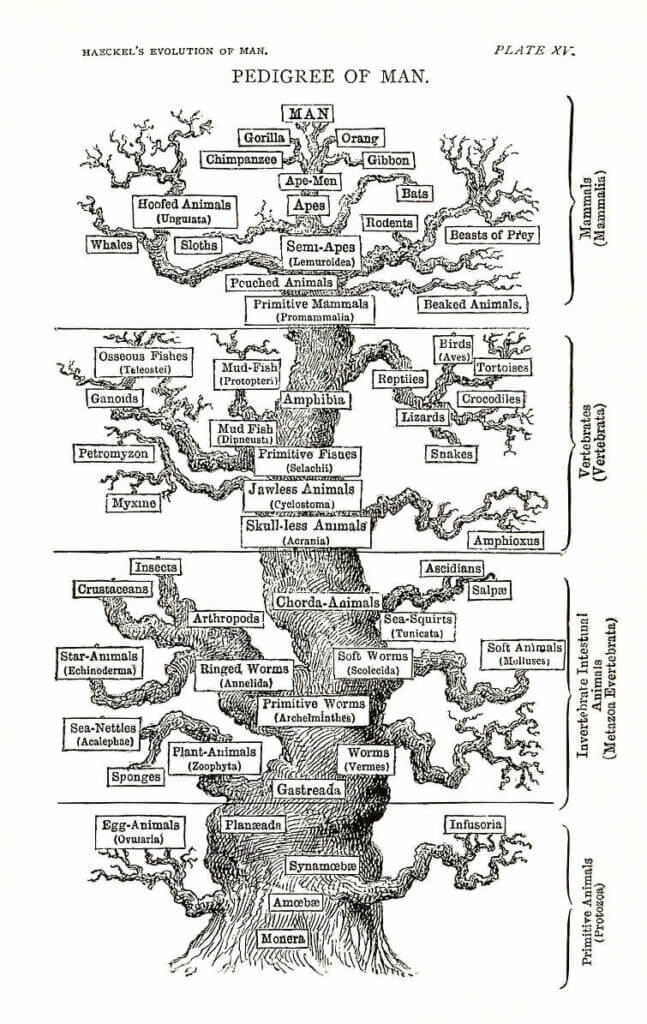
Ernst Haeckel's "Pedigree of Man" tree diagram from 1874(2)
Visual devices help us organize information, see the bigger picture, and make sense of the surrounding world. They make complex problems and ideas easier to bite into.
When it comes to teamwork, visual collaboration is an effective way of conveying and receiving information. It lets us tap into a spatial dimension of work.
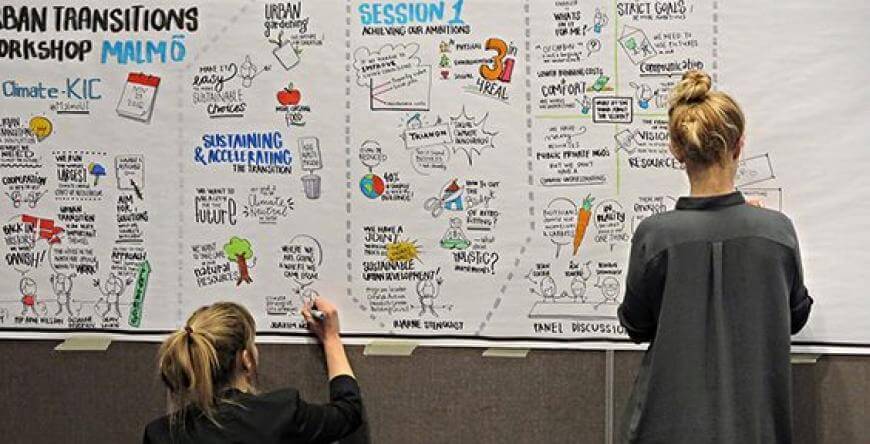
A collaborative whiteboard by EIT(3)
Whiteboards and Post-it notes are fine examples of tools that aid visual collaboration. Both discovered by accident, they took corporate offices by storm in the 1980s and have since achieved a cult-like status.
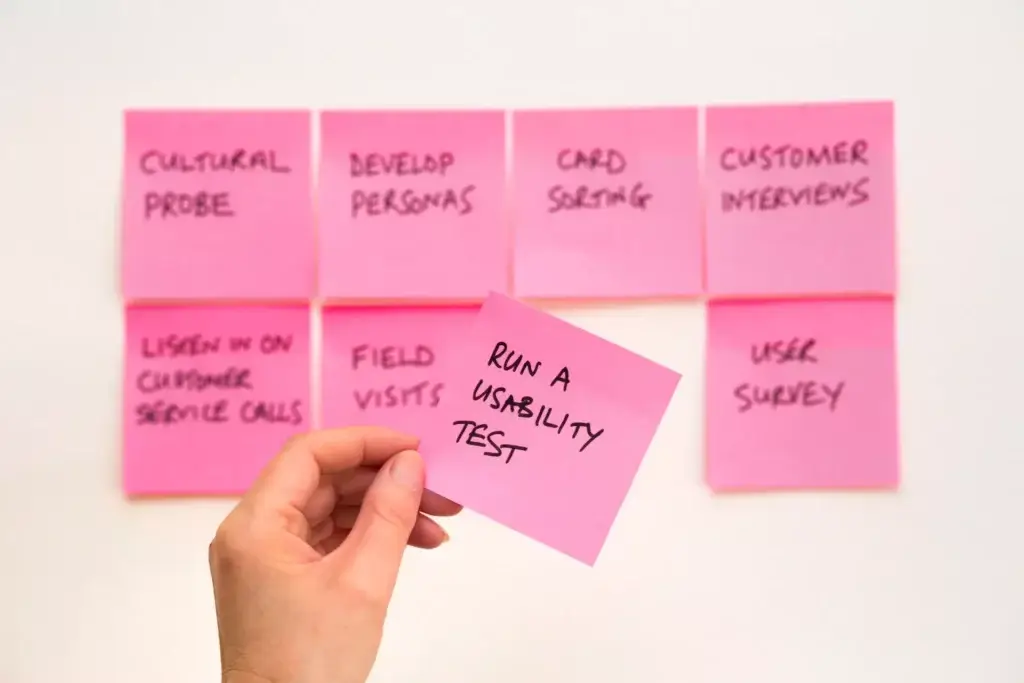
Photo by David Travis via Unsplash(4)
Now, over forty years since their invention, it's time for a change.
Visual Collaboration in a Remote Workplace 👨💻👩💻
The pandemic pivot to remote work changed the way we work and collaborate.
The growing demand for collaboration tools like digital whiteboards means we're also shifting away from analog tools. And this is where Taskade comes into play.
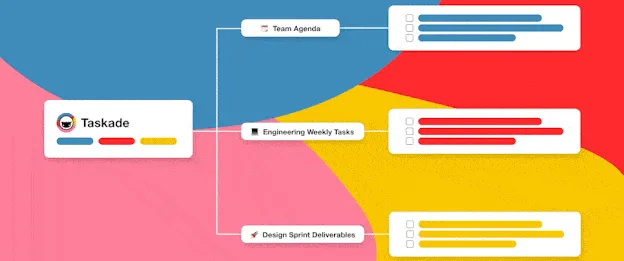
Taskade enables remote teams to chat, organize, and get things done without friction.
Envision a workflow from ideas to action, without shuffling multiple apps.
Taskade stores your tasks and notes in a tree-structured database. This gives you the flexibility to transform your garden-variety workflows with the click of a button.
Let’s take a look at each of the Project Views and what they can do.
Visual Collaboration: Taskade Projects Views 🐑
1. The List View 📋
What's the Story? 🔍
Lists are the true power tools of the modern workplace. They help us index and organize all kinds of information in a comprehensible orderly fashion.
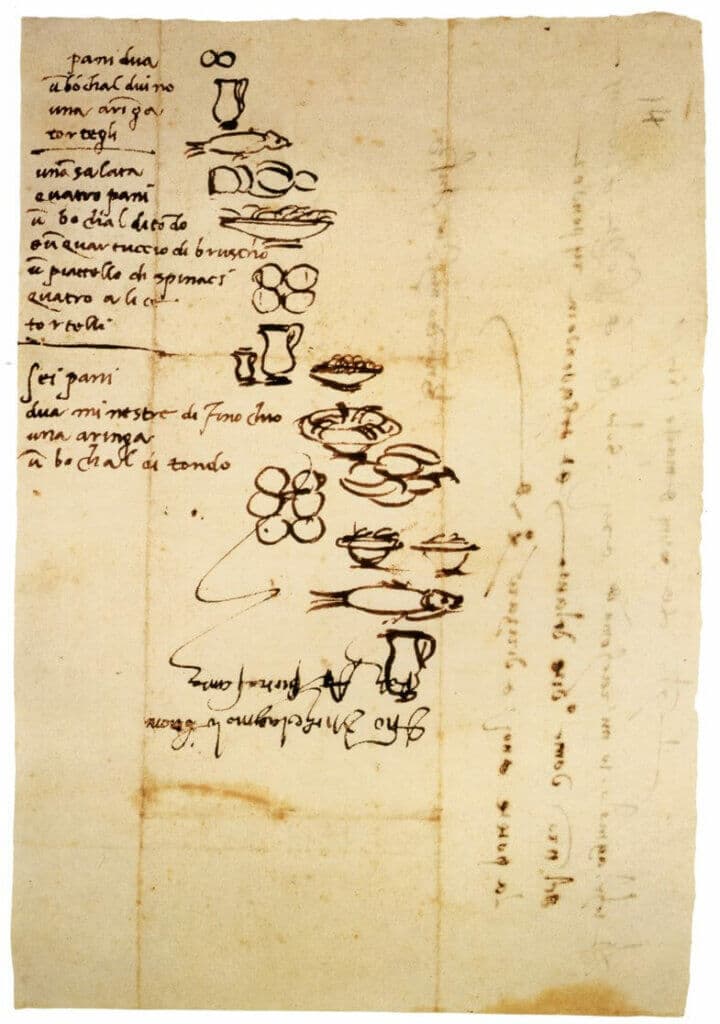
Michelangelo’s grocery list(5)
We love listicles because they bring order to the utter chaos of the world. Heck, Umberto Eco loves lists because he believes they "make infinity comprehensible."
And that's a pretty compelling testimonial.
"The list is the origin of culture. It's part of the history of art and literature. What does culture want? To make infinity comprehensible. It also wants to create order -- not always, but often. And how, as a human being, does one face infinity? How does one attempt to grasp the incomprehensible? Through lists, through catalogs, through collections in museums and through encyclopedias and dictionaries."(6)
We can trace the origins of listicles to the Medieval sword-brandishing and shield-smacking days. The word "lists" was originally used to refer to the arena where knights would clash their lances during tournaments.(7)
How to Use Lists for Visual Collaboration 👁
At a glance, lists don't look like much. They're linear, have a top-down hierarchy, and lack aesthetic appeal. That is until you start transforming them into outlines.
As we explained in Past, Present, and Future of Outlining Software 🐑, outlining is a process of visualizing hierarchical structures that contain whatever you’re working on.
Collaborative outlining—whether it's for planning projects, drafting documents, or building checklists—is a great way to improve team collaboration with visual cues.
Taskade List Workflow 🐑
🔄 Replaces: Todoist, TickTick, Workflowy, Notion
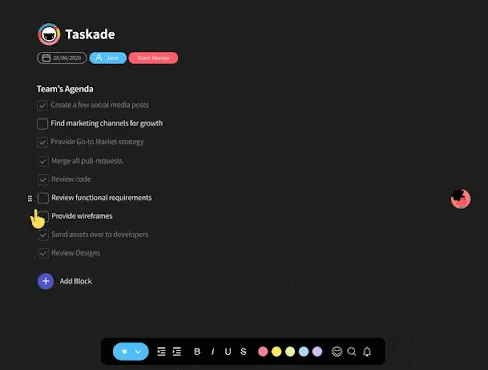
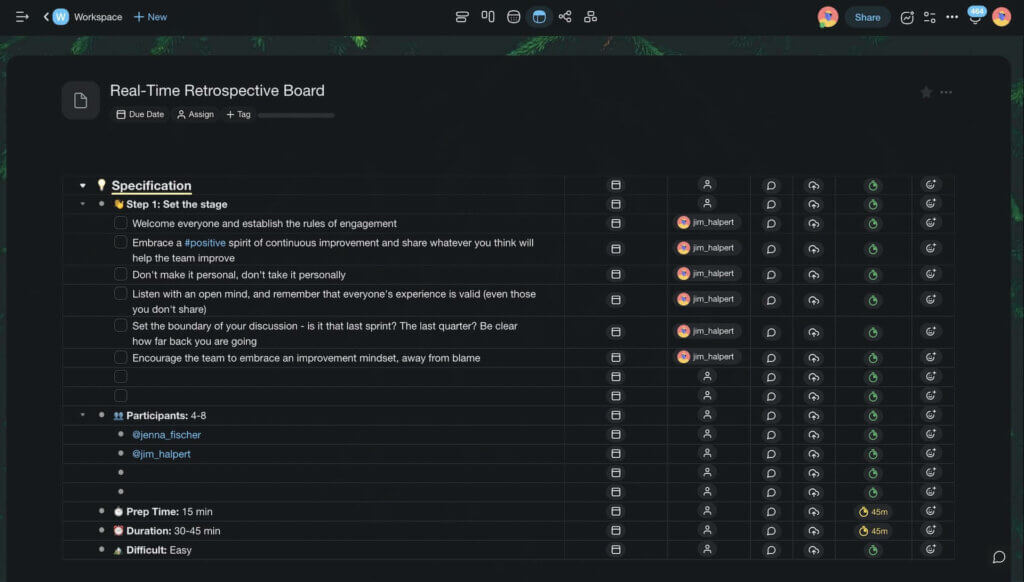
List is the default project view in Taskade. It's the first thing you see when you create a new Project. Here's a simple retrospective template you can collaborate on with your team.
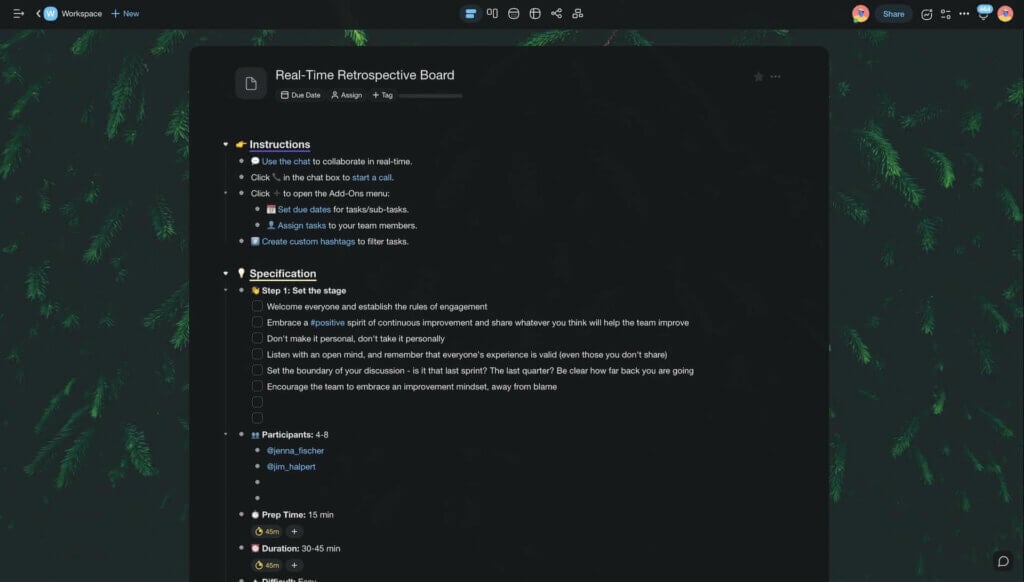
Taskade List view
Notice how the elements in the top section have other elements "nested" under them. This is called outlining. Indentations help visualize hierarchical relationships between content blocks at a glance. To indent a task, press the ⌨️ Tab button on your keyboard.
2. The (Kanban) Board View 📍
What's the Story? 🔍
Kanban is a visual workflow that uses boards and cards for managing projects. Originally used in manufacturing, it was later adapted to IT and knowledge work.
Like many other productivity improvements, the Kanban methodology originated with one of the post-war Japanese companies, the Toyota Motor Corporation.
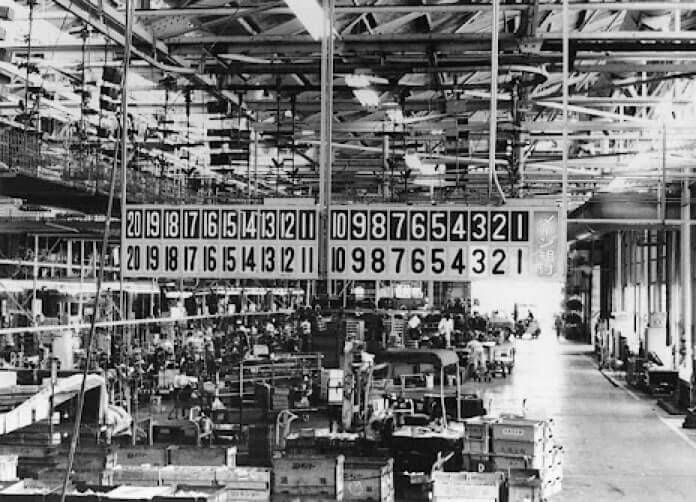
Andon board, a.k.a. “problem notification device”
at Toyota’s Kamigo plant (1966) by Toyota Global(7)
These days, Kanban has evolved into a universal productivity supertool and has been successfully applied too kinds of projects across all kinds of industries.
How to Use Kanban Boards for Visual Collaboration 👁
The core elements of Kanban include boards which consist of columns and cards. Individual cards make up work items while columns represent steps in a workflow.
What workflow exactly? Well, that depends on what you need it for. One of the most universal Kanban workflows breaks down into three steps, TO DO, DOING, and DONE.
But planning and managing projects is just one way your team can use Kanban. Other examples include editorial calendars, product feature trackers, or sales pipelines.
Taskade Board Workflow 🐑
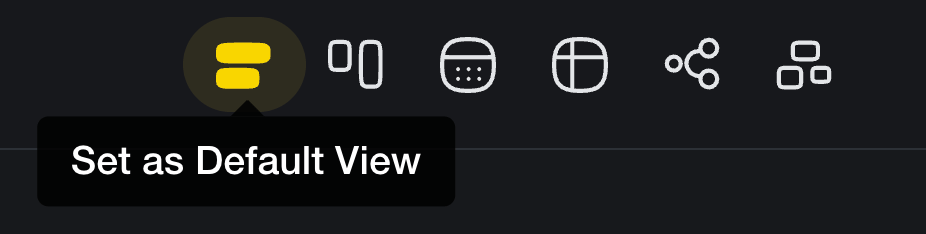
To select the Kanban Board view in Taskade, navigate to the Project View switcher at the top right corner of your Project. Click the star icon to set the view as default.
The best part about Taskade views is that you can transform a simple list—like the one we created earlier—into a fully functional Kanban workflow.
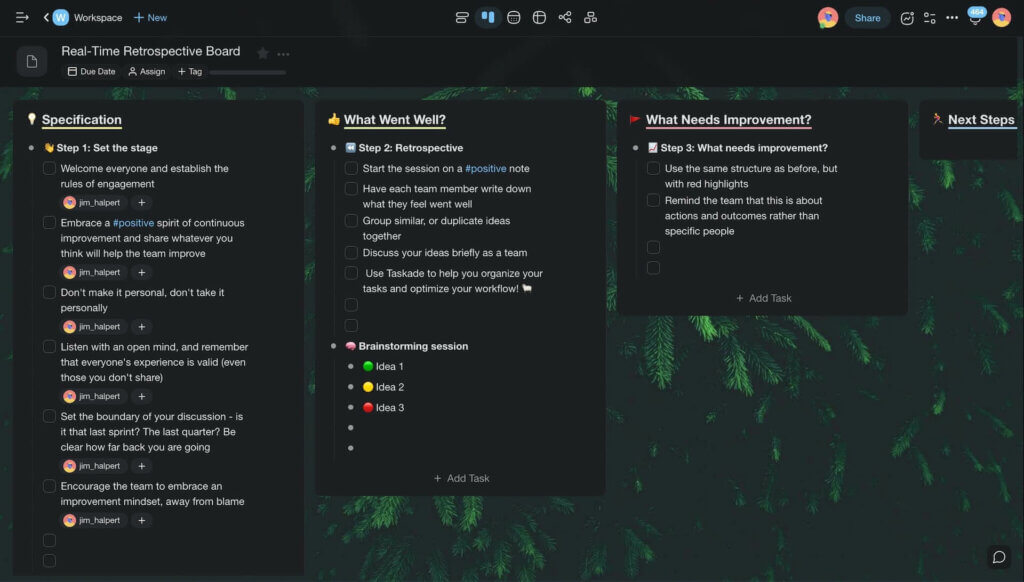
Taskade Board view
Each parent element from the original list is now a separate card while all child elements have turned into individual work items. Lists and boards share the same data set, but they let your team tackle projects in two completely different ways you can switch between in an instant.
3. The Action View ⏰
What's the Story? 🔍
You can think of the Action View as a more granular take on regular to-do lists. Typical action items have an owner and a due date, but they can include other details.
Here are a handful of examples. 👇
🗓 @peter, edit and share meeting notes by 01/06/2021
🗓 @jane, submit follow-up questions before the next meeting
🗓 @jane, update project specs by 20/06/2021 09:00 PT
The concept of action items is closely tied to David Allen's Getting Things Done methodology. GTD specifies "Next Actions" as more meaningful to-dos.
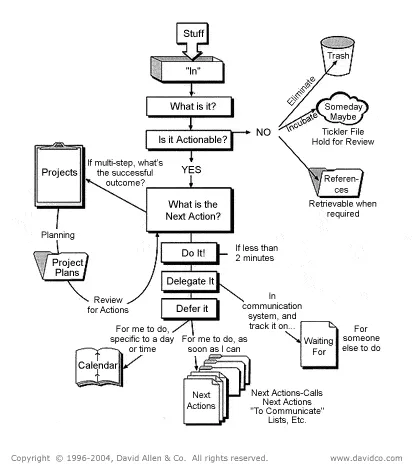
David Allen’s Getting Things Done® workflow(8)
Specific context-rich action items are usually formulated as part of meeting minutes. They reduce ambiguity by providing valuable context information for each task.
"90+ % of the to-do lists I’ve seen are incomplete inventories of still-unclear things. The Next Action definition (if you’re really getting down to having no ambiguity about the next visible physical activity required to move something forward), actually finishes the thinking you’ve implicitly agreed with yourself that you’ll do.”
David Allen, Getting Things Done(7)
How to Use Action Items for Visual Collaboration 👁
You can use action items to increase visibility across the team. Since action items are much like steps in a manual, it's much easier to complete them in a logical order.
Like lists, action items are not inherently visual, although they use an organized table format. You can still capitalize on visual input, e.g. by assigning color-coded priorities.
Taskade Action Workflow 🐑
- 🔄 Replaces: Monday.com, ClickUp, Asana
Taskade’s Action view lets you display every Project as a table of action items, complete with due dates, comments, and descriptions.
Using our previous example, let's break the retrospective board down and assign each collaborator a part of it. You can set task owners, due dates, or add comments.
Taskade Action view
On top of the Action view, Taskade lets your team track all assigned action items in the My Tasks dashboard. It's a convenient way to check who's working on a task and when the work is due. You'll find My Tasks in the left navigation bar in any of your Workspaces.
4. The Mind Map View 🧠
What's the Story? 🔍
Mind maps are one of the best examples of visual devices. A mind map is a hierarchical diagram representing a central topic and peripheral, associated concepts.
Mind mapping is also one of the oldest recorded attempts at knowledge organization. We can trace its roots (pun intended) to a 3rd-century logician Porphyry of Tyre.
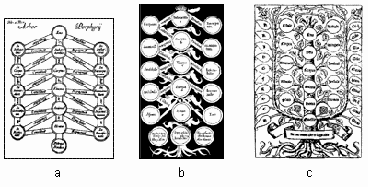
Variations of the Porphyrian tree(9)
Mind mapping is the go-to brainstorming tool—both in its classic pen & paper and digital form—for creatives, academics, and students across the board.
How to Use Mind Maps for Visual Collaboration 👁
Collaborative mind mapping is a great way to brainstorm ideas and find non-linear solutions to problems. It helps generate many ideas in the shortest time possible.
Collaborative mind mapping lets teams organize information, clarify thoughts, capture complex topics in an easily comprehensible form, and even plan and manage projects.
Taskade Mind Map Workflow 🐑
Taskade's Mindmap view is a left-to-right horizontal workflow. You start by placing the core element—an idea, problem, or concept—on the left and branch out to the right.
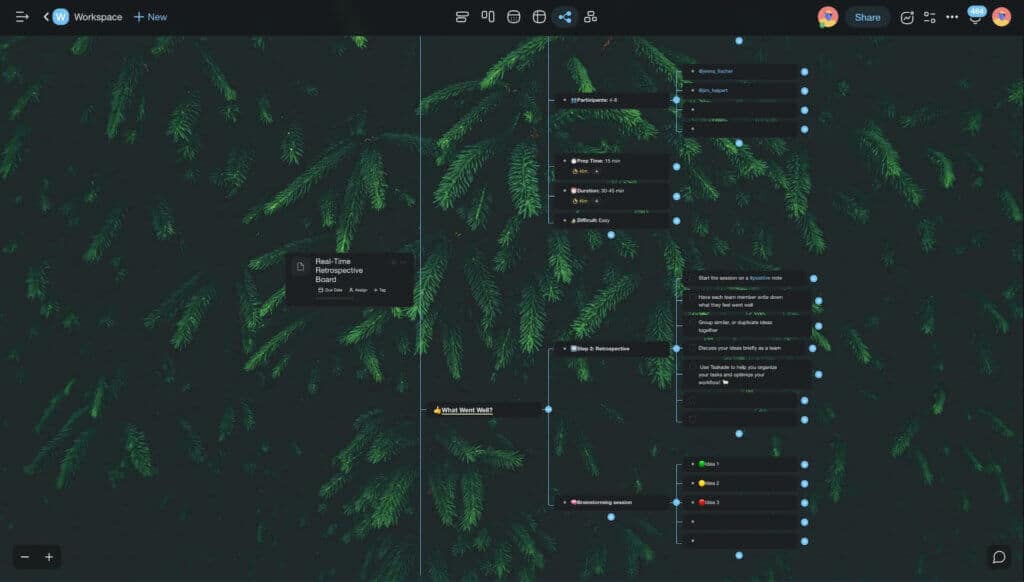
Taskade Mind Map view
As you can see, we can easily transform our action sheet from the previous section into a mind map. We already have the items assigned to categories as well as task/item owners.
5. The Org Chart View 🌟
What's the Story? 🔍
The organizational chart—also called an organigram—is a type of hierarchical tree diagram used for visualizing formal organizational structures.
The org chart was invented by engineer Daniel McCallum at the Erie Railroad company in the Mid 1800s. McCallum created a diagram representing departments, employees, and roles to improve the flow of information at the company.
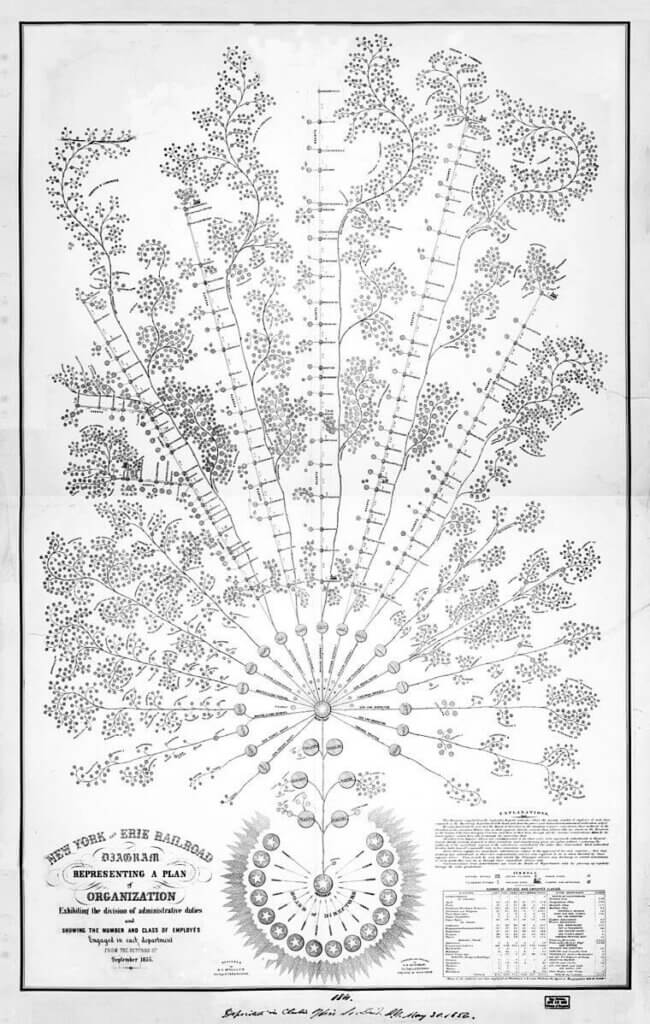
Organizational diagram of the New York and Erie Railroad (1855)(10)
The organizational chart evolved over the years, from the inverted tree-like structure through pyramid-shaped diagrams to a matrix and entirely flat representations.
How to Use Org Charts for Visual Collaboration 👁
Organizational charts use parent/child coding to signify formal relationships between people in a team, company, or organization.
Of course, you can also use org charts to visualize other types of hierarchical systems. This can include product groups/families, processes, and workflows.
Taskade Org Chart Workflow 🐑
Taskade's Org Chart view lets you easily map out hierarchical structures in a top-down workflow. Let’s use it to organize the branches and nodes of our mind map vertically.
The top-down workflow shows the importance of each category of items in the hierarchy. You can easily add new elements to the pool or drag-and-drop to reorganize.
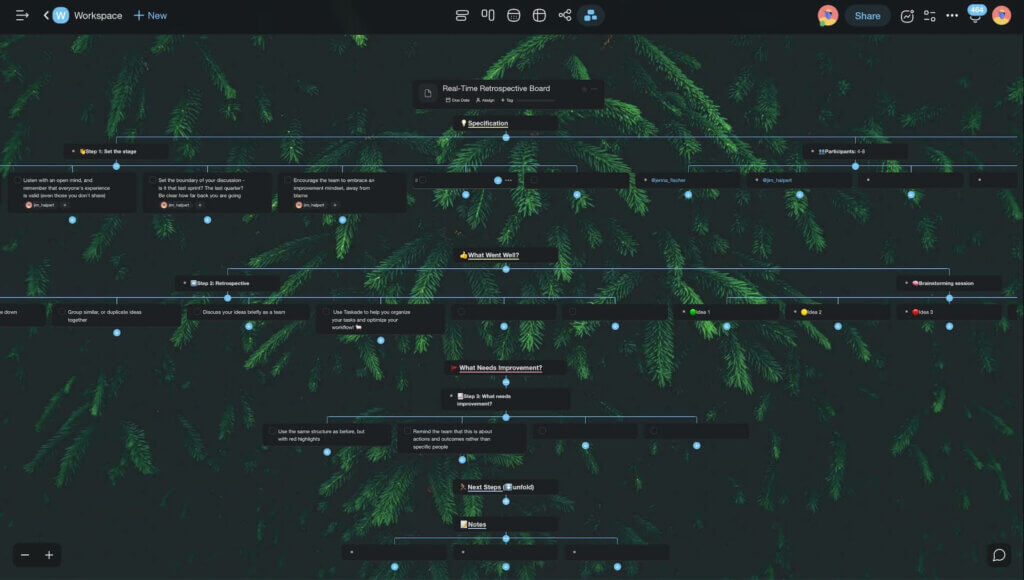
Taskade Org Chart view
And that’s it!
Parting Words 👋
Visual devices make ordinary processes much more engaging. Adding the visual component to team collaboration is a great way to improve creativity and innovation.
But that’s not all.
Visual collaboration reduces the cognitive burden associated with processing large amounts of data. It increases team velocity and helps analyze complex issues in a blink.
Boost team collaboration with Taskade AI! 🤖
🤖 Custom AI Agents: Leverage AI agents, each with a unique personality, knowledge, and skills, to support all aspects of team collaboration.
🪄 AI Generator: Generate detailed document outlines and project structures based on natural-language descriptions and seed documents.
✏️ AI Assistant: Employ the AI Assistant for real-time writing and task management support in the project editor, powered by OpenAI GPT (frontier models).
🗂️ AI Prompt Templates Library: Access specialized AI prompt templates designed for creating and managing team workflows.
💬 AI Chat: Use AI's knowledge to brainstorm and iterate on ideas. The AI Chat is seamlessly integrated into every project you create.
📄 Media Q&A: Analyze team documents and spreadsheets to extract insights, patterns, and key ideas, all using a conversational interface.
And much more...

Resources 🔗
Frequently Asked Questions
What is visual collaboration and why is it effective?
Visual collaboration uses graphical formats like mind maps, kanban boards, outlines, and org charts to organize and communicate information. It's effective because the human brain processes visual information 60,000 times faster than text — making it easier to understand complex relationships, spot patterns, and align teams quickly.
When should you use mind maps vs. kanban boards?
Use mind maps for brainstorming, exploring ideas, and mapping relationships between concepts. Use kanban boards for tracking task progress through defined stages like To Do, In Progress, and Done. Mind maps are best for the creative phase, while kanban boards excel during execution.
What are the main types of visual collaboration tools?
The main types are mind maps (radial idea exploration), kanban boards (workflow tracking), outlines (hierarchical information), org charts (team structure), Gantt charts (timeline planning), and tables (structured data). Taskade offers all of these as interchangeable views of the same project — 7 views total.
Can you switch between different visual views of the same project?
Yes. In Taskade, you can create a project and instantly switch between List, Board, Calendar, Table, Mind Map, Gantt, and Org Chart views. The underlying data stays the same — you just change how you visualize and interact with it, matching the view to the task at hand.